


Real US Interest Rates Are Too High
Interest-Rates / US Interest Rates Sep 03, 2008 - 02:19 AM GMTBy: Mike_Shedlock

 I am going to make a shocking statement. Here it is: Real interest rates are high. Before stating the basis for such a seemingly wild claim it is important to define some terms. In this case "real" means inflation adjusted.
Of course this means we have to agree on the meaning of the word "inflation". For this discussion I am going to waver from my usual stance that "Inflation is an increase in money supply and credit" to something mainstream.
For this post, let's assume that "Inflation in an increase in the price of a representative basket of goods and services".
The CPI
The CPI is the most widely accepted measure of a "representative basket of goods and services" so let's start there.
Consumer Price Index - Urban Consumers - All Items
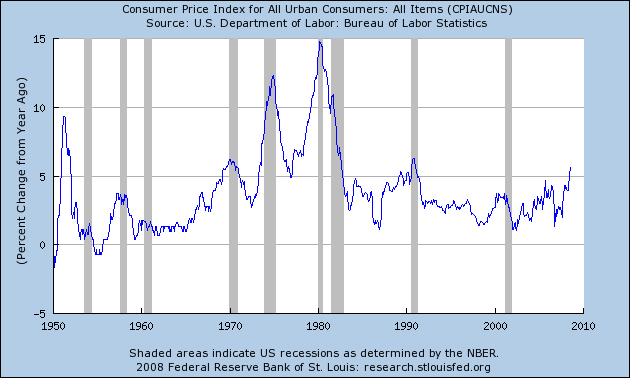
The above chart courtesy of St. Louis Fed .
The CPI itself is running at 5.6% vs. a year ago.
Please consider the following chart on Real Interest Rates.
Real Interest Rates
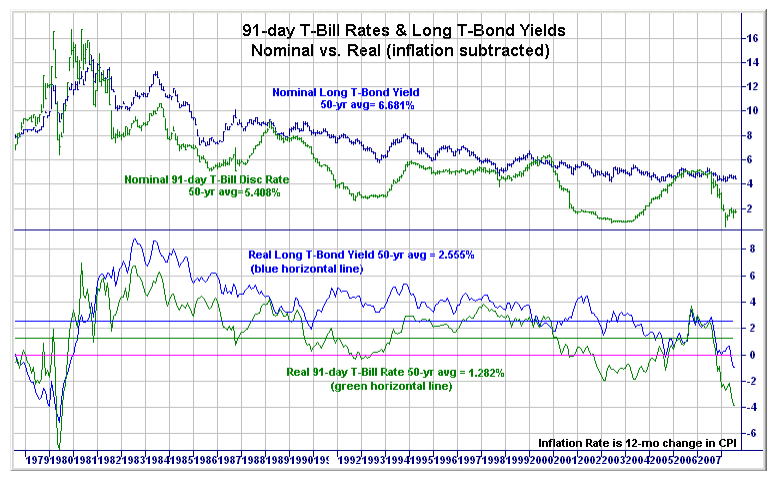
The above chart courtesy of Martin Capital Advisors
So far all I seem to have done is verify just how preposterous my claim was. The above chart shows that Real 91-date T-Bill is running close to -4%, and the long bond is running close to -1%.
Are Real Treasury Rates That Negative?
The answer is no they are not, assuming one uses a "representative basket of goods and services" by which to judge.
Earlier I stated the CPI was the most widely accepted measure (and it is), but that does not mean it is truly "representative" of anything.
Inquiring minds no doubt are now asking "What's wrong with the CPI?" It's a good question too. The big problem is housing. Home prices are crashing and those prices are not adequately reflected in the CPI. Instead, the single largest component of the CPI is " Owners Equivalent Rent ". OER is a process in which the BEA estimates what it would cost if owners were to rent the homes they own from themselves. I do not believe this to be a valid construct of prices.
By ignoring housing prices, the CPI massively understated inflation for years. The CPI is massively overstating inflation now.
In normal times with rents in sync with home prices, it did not matter much if one used OER or actual home prices. It's a remarkably different story now. We have just seen the biggest housing bubble in the history of the world. At the peak of insanity, home prices were 3 standard deviations above rental prices and 3 standard deviation above wage growth.
Now, the important factor is that home prices are crashing, with quite a big drop still needed to get back to historic norms. With that in mind, housing can be expected to be weak for quite some times.
The treasury market seems to have figured all this out quite nicely. Pundits screaming "treasury bubble" clearly have not.
Case-Shiller vs. Owners Equivalent Rent
Case-Shiller shows that home prices have declined 15.4% over the past year. Currently, OER is the largest component of the CPI at nearly 24%.
A CS-adjustment (substituting Case-Shiller for OER in the CPI) would knock 3.7% off the CPI (15.4 * .24).
We must also take into account the reported OER was +2.6 vs. a year ago. It's affect on the CPI is (2.6 * .24) or .624 of the reported 5.6%. Rounding to the nearest tenth, another .6 needs to be subtracted from the adjusted CPI. (5.6 - 3.7 - .6 = 1.3)
This would make the CS-CPI +1.3% instead of the reported 5.6%
BLS Verification
I contacted Steve Reed at the BLS to confirm my numbers. Steve came up with the same number although it was via a slightly different method. Mathematically I believe they are the same, but the important point is the verification of the number itself.
Steve Reed writes:
I did an example based on the OER declining 15.4 percent. I get a result that this would cause the all items index to increase 1.3% instead of 5.6%
I decomposed the AI index into OER and AI less OER. The easiest way to do this is just to give each index a base of it's relative importance, which automatically weights things correctly and makes the indexes additive. So, the all items index is literally the rebased OER index + the All items less OER index, So, when you do a hypothetical OER, you can just add it back to the All less OER to get a hypothetical All items.
Since there was a new set of weights put in during the middle of the period we are studying, this isn't precisely accurate--to really have the exactly correct weight for OER during each time period would take several steps and be a real pain--but the error should be small.
Steve Reed
Thanks Steve!
CS-CPI vs. Real Long Term Averages
CS-CPI is +1.3%
Real 3 Month Treasury Yield vs. Long Term Average
- Current 3 Month Treasury Yield is 1.72%
- Real CS-CPI is .42%
- Long term Average Martin Capital Real 3 Month Treasury Yield 1.28
- Current 30 Year Long Bond Yield is 4. 41%
- Real CS-CPI is 3.11%
- Long term Average Martin Capital Real Long Bond Yield 2.56
Factoring in home prices, real 3 month treasury yields are a bit under long term averages while the 30 year long bond yields are a bit over long term averages. This assumes Case-Shiller is an accurate representation of home prices. I believe Case-Shiller declines are understated because they ignore homebuilder discounts on new home sales. (Case-Shiller only looks at repeat sales of the same property).
If one assumes like I do, that home prices are really down 20% then the CPI (using the same methodology) is approximately .2%, real 3 month treasury yields are +1.52, and real 30 year long bond yields are 4.21%. Either way, the above numbers are a shocking difference from the reported numbers.
Do home prices belong in the basket?
I have had many people over past year tell me they do not care about home prices because they rent, or tell me that do not care about home prices because they own their home outright, or tell me they do not care about home prices because their house is a long term investment.
People may not care (or more realistically they may think they do not care), but the treasury market sure cares about something , and the most likely something is the destruction of wealth in housing along with the ramifications the housing market has on bank credit, corporate earnings, consumer attitudes, etc.
It's true that a person does not buy a home every week but that same person does buy food and gasoline every week. However, that does not make the price decline any less real. More importantly, it is naive to think treasuries should ignore the ongoing destruction of wealth in housing and the bank writeoffs that bust is causing.
Let's look at this from a practical standpoint. What's more important, home prices dropping $50,000 to $250,000 in value over the course of a few years or the price of gasoline going from $2.00 a gallon to $4.00 a gallon over the course of those same few years?
From a macro-economic standpoint, the correct answer to the above question is housing even though consumers were constantly griping about gasoline prices until the recent selloff. The easily seen is gasoline price hikes because people buy it every week. Practically speaking, the destruction of housing wealth matters far more. Here is the question to ask: How many tanks of gas will it take to equal the loss of $50,000 on a house?
On this basis, the so-called "irrational behavior" of the long bond specifically, and the entire treasury curve in general, does not seem so irrational.
Unprecedented Housing bubble
In previous decades, rental prices and home prices were basically in sync. In that model it would not have made much difference in the CPI whether OER or actual home prices were used to calculate the CPI. It makes a huge difference now.
More recently, housing prices soared 3 standard deviations above norm vs. rental prices. And while prices were rising, the CPI was enormously under-stated. Now the CPI is horrendously over-stated.
Let's do a little reality check.
Does anyone believe credit to be looser and inflation faster now than when home prices were soaring 100% or more year over year? I don't, but that's what the chart from Martin Capital Advisors shows. By the way, I am not critical of that chart. It is what it is and I thank Martin Capital for posting it.
CPI And The Rear View Mirror
It's very important to look out the windshield and not the rear view mirror when it comes to expected changes in the price of a representative basket of goods and services. More importantly, it is very important to pay close attention to attitudes changes about major purchases in that basket. That attitude change is massive. Never before in history have so many been willing to walk away from their homes.
A secular peak in consumption has been reached. We are now on the backside of Peak Credit . Those blindly paying attention to energy and food prices and little else are missing this vital analysis.
Now that energy prices have started to drop, year over year comparisons on the CPI are going to be very easy to beat. And by properly factoring in home prices, the CPI will likely be negative, perhaps hugely negative in the months ahead.
Real interest rates (using the suggested housing correction) will soon be soaring well above the long term averages as shown in the above chart.
Is there Justification For This Methodology?
For the record, I do not think it is possible to easily define and measure the prices of a representative basket of goods and services. However, the basket I presented makes more sense than the widely used CPI basket. It at least explains the so-called "irrational bond market" and it also accounts for the percentage of home ownership instead of attempting to figure out how much rent one would pay renting a house from oneself.
Problems Defining A Representative Basket
One problem with defining a basket of consumer goods is that such consumer baskets by definition ignore asset bubbles in the stock market and other places. For more discussion of this topic please see Inflation: What the heck is it?
Ignoring asset bubbles is what gets the Fed in deep trouble time and time again. The current CPI ignored the housing bubble on the way up and down. Is it any wonder the Fed is always chasing its tail?
And it is because the Fed ignores asset bubbles and because the Fed depends on a completely ill-formed measure of "inflation", that the Fed continually looks foolish when it comes to monetary policy. Inflation is after all a monetary phenomenon not a price phenomenon.
The solution to this mess is to eliminate the Fed and let the market set rates instead of letting the Fed micro-manage the economy to death.
Two More Measure Of High Real Interest Rates
There is still two more measure one can look at to determine whether or not real interest rates are high: Demand For Money, and Expected Return.
Demand For Money
There is a huge demand for money right now. Banks do not want to lend and consumers do not want to spend. Frugality Is The New Reality .
If we were in some massive inflationary period, people would be spending money as fast as they got their hands on it instead of saving it as noted in What's Behind The Soaring Savings Rate .
There are still many who have not figured out how massively deflationary crashing home prices are. Indeed, wild screams of hyperinflation still come from many corners in spite of the fact that there has never been a hyperinflation in history where housing prices crashed and the savings rate rose.
Housing prices are clearly crashing and the savings rates is indeed rising (the latter from a very low level).
In Austrian economic terms there has been a massive shift in "time preference". It is reflective of what one would expect if money could be put to better use later than now. Indeed the expectation is that home prices are going to fall, car prices are going to fall, and/or its simply better to wait.
Of course a case can be made that consumers are so tapped out they cannot spend if they want to, but the result will be the same: falling demand eventually means falling prices all other things being equal.
Return On Investment
The third measure of whether interest rates are high is in conjunction with what returns one might get by borrowing money. Outside of energy or production of some commodities, I cannot think of anything that is not in a massive state of over-capacity.
That overcapacity in conjunction with rising unemployment means that profits are going to be very difficult to come by. Indeed, there is no point to borrow money if expected returns are negative. Currently one cannot count on positive returns from the stock market, the corporate bond market, carry trades, housing, restaurants, nail salons, or even gold, silver, energy, and other commodities. Leverage is being forced out of the system at every turn.
Of course there are some Pollyannas who always think a massive recovery is just around the corners. However, banks are not acting as if a recovery is coming soon, nor is the treasury market, nor is the corporate bond market, nor are credit default swaps and various risk spreads.
Indeed the corporate bond market is acting as if it's Dead Banks Walking . And dead banks walking in my opinion is a continuation of the deflationary period we are in.
Three Measures Say The Same Thing
As measured by a "representative basket of goods and services", demand for money, or expected return on investment, real interest rates are reasonably high and about to get much higher! There simply is no bubble in treasuries.
By Mike "Mish" Shedlock
http://globaleconomicanalysis.blogspot.com
Click Here To Scroll Thru My Recent Post List
Mike Shedlock / Mish is a registered investment advisor representative for SitkaPacific Capital Management . Sitka Pacific is an asset management firm whose goal is strong performance and low volatility, regardless of market direction.
Visit Sitka Pacific's Account Management Page to learn more about wealth management and capital preservation strategies of Sitka Pacific.
I do weekly podcasts every Thursday on HoweStreet and a brief 7 minute segment on Saturday on CKNW AM 980 in Vancouver.
When not writing about stocks or the economy I spends a great deal of time on photography and in the garden. I have over 80 magazine and book cover credits. Some of my Wisconsin and gardening images can be seen at MichaelShedlock.com .
© 2008 Mike Shedlock, All Rights Reserved
Mike Shedlock Archive |
© 2005-2022 http://www.MarketOracle.co.uk - The Market Oracle is a FREE Daily Financial Markets Analysis & Forecasting online publication.