


A Method Traders Can Use to Confirm an Elliott Wave Count
InvestorEducation / Elliott Wave Theory Dec 13, 2017 - 02:57 PM GMTBy: EWI

 When you are watching a pattern develop on a chart, how can you be sure that your Elliott wave count is correct? Elliott Wave International's Senior Analyst Jeffrey Kennedy spent years designing his own technique to improve his accuracy. He came up with the Kennedy Channeling Technique, which he uses to confirm his wave counts. The following excerpt from Jeffrey's Trader's Classroom lessons offers an overview of his method. Get more trading lessons from Jeffrey in his popular free eBook, The Best of Trader's Classroom.
My theory is simple: Five waves break down into three channels, and three waves need only one. The price movement in and out of these channels confirms each Elliott wave.
Base Channel
Figure 61 shows three separate five-wave patterns with three different channels drawn: the base channel, the acceleration channel and the deceleration channel.
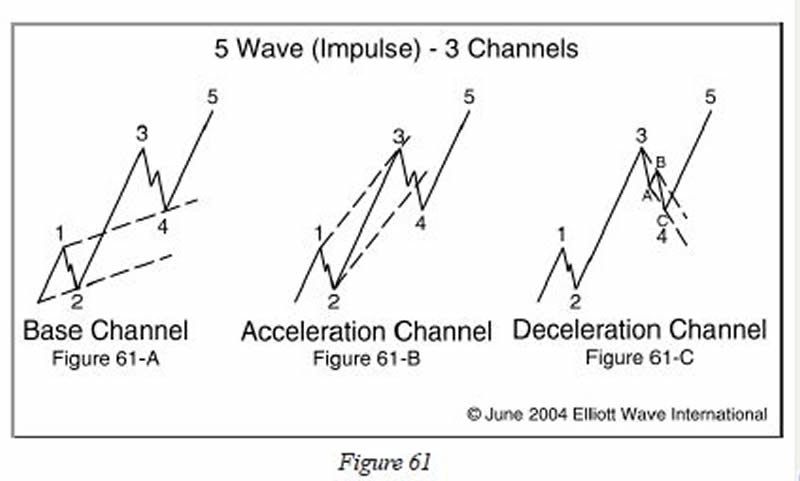
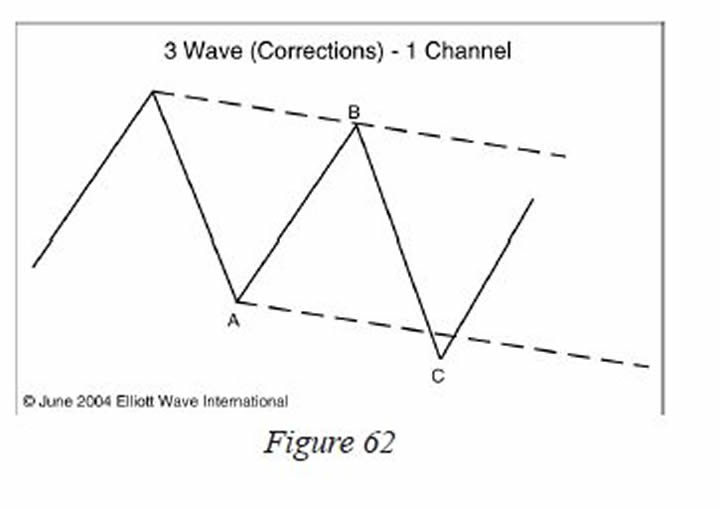
The base channel contains the origin of wave 1, the end of wave 2 and the extreme of wave 1 (Figure 61A) [waves 1 and 2 connect with a line, then draw a parallel line along the top of wave 1]. Of the three channels, the base channel is most important, because it defines the trend. As long as prices stay within the base channel, we can safely consider the price action corrective. Over the years, I've discovered that most corrective wave patterns stay within one price channel (Figure 62). Only after prices have moved through the upper or lower boundary lines of this channel is an impulsive wave count suitable, which brings us to the acceleration channel.
Acceleration Channel
The acceleration channel encompasses wave 3. Use the extreme of wave 1, the most recent high and the bottom of wave 2 to draw this channel (Figure 61B) [draw the line from the top of wave 1 to the top of wave 3, then draw a parallel line starting at the bottom of wave 2]. As wave three develops, you'll need to redraw the acceleration channel to accommodate new highs.
Once prices break through the lower boundary line of the acceleration channel, we have confirmation that wave 3 is over and that wave 4 is unfolding. I have noticed that wave 4 will often end near the upper boundary line of the base channel or moderately within the parallel lines. If prices break through the lower boundary line of the base channel decisively, it means the trend is down, and you need to draw new channels.
Deceleration Channel
The deceleration channel contains wave 4 (Figure 61C). To draw the deceleration channel, simply connect the extremes of wave 3 and wave B with a trend line. Take a parallel of this line, and place it on the extreme of wave A. As I mentioned before, price action that stays within one price channel is often corrective. When prices break through the upper boundary line of this channel, you can expect a 5th-wave rally next.
In a nutshell, prices need to break out of the base channel to confirm the trend. Movement out of the acceleration channel confirms that wave 4 is in force, and penetration of the deceleration channel lines signals that wave 5 is under way.
[Elliott wave patterns are fractal, meaning they occur on small and large scales. Therefore, it is also possible this entire pattern could all occur within a much bigger trend channel.]
14 Critical Lessons Every Trader Should KnowSince 1999, Jeffrey Kennedy has produced dozens of Trader's Classroom lessons exclusively for his subscribers. Now you can get "the best of the best" in these 14 lessons that offer the most critical information every trader should know. Find out why traders fail, the three phases of a trader's education, and how to make yourself a better trader with lessons on the Wave Principle, bar patterns, Fibonacci sequences, and more! Don't miss your chance to improve your trading. |
This article was syndicated by Elliott Wave International and was originally published under the headline . EWI is the world's largest market forecasting firm. Its staff of full-time analysts led by Chartered Market Technician Robert Prechter provides 24-hour-a-day market analysis to institutional and private investors around the world.
© 2005-2022 http://www.MarketOracle.co.uk - The Market Oracle is a FREE Daily Financial Markets Analysis & Forecasting online publication.