


Bitcoin and Stock Prices, Both Symptoms of Speculative Extremes!
Stock-Markets / Financial Markets 2018 Jan 17, 2018 - 12:01 PM GMTBy: Enda_Glynn

 Hi everyone.
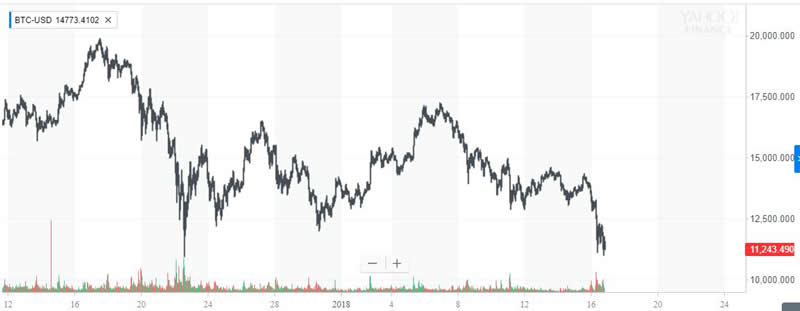
I had another look at bitcoin today!
The low of the day is hit 11121 so far,
So the price has collapsed 43% since the 17th of December.
Thats a hell of a decline for the so called 'asset' that was on its way to the moon!
And all those folks who bought into the sure thing of the century,
The new shiny object in the shop window,
are now licking their wounds,
and wondering how they could ever do such a stupid thing as buy at the top.
Why did nobody see this collapse coming??
Mmm,
Am I speaking about the stock market or bitcoin here!
I have said it before and I will say it again,
Bitcoin is a harbinger for the economy and the financial markets as a whole.
It's monumental rally over the last year,
was a indication of the extreme appetite for speculation in the general public.
And now, the monumental crash that it is undergoing,
is a signal of the shift in the mood of that very same public,
away from speculation and towards a more frugal outlook.
Bitcoin is at the fringe of all things speculative,
And so it is collapsing first.
The dominoes will fall inwards towards the center of the financial world.
Just as they did in 2007.
And that center consists of the sovereign bond markets and the prominent stock indices.
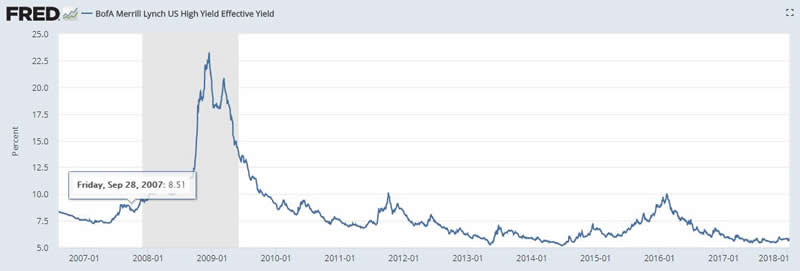
The next domino to fall will be high yield credit,
Which has been sitting at or near all time lows lately.
As for the stock market:
Last week saw another extreme in bullishness within the professional finance world.
-64.4% of investment advisors were bullish
and just 13.5% bearish.
This is the largest divergence in over 30 years!
Maybe stocks will be the next domino to fall after all!
UPCOMING RISK EVENTS:
USD: Capacity Utilization Rate, Industrial Production m/m,
EUR: Final CPI y/y,
GBP: N/A.
JPY: N/A.
DOW JONES INDUSTRIALS
My Bias: market topping process completing
Wave Structure: Impulsive 5 wave structure, topping in an all time high.
Long term wave count: topping in wave (5)
The DOW has seen its first impulsive looking decline today
after reaching another all time high at 26082.
The price declined 300 points into the low of the session at 25708 a few moments ago.
If the bear market is going to start here,
this counts as a good start for sure.
From here the key price action I am looking for is a clear five waves down off the high,
Followed by a clear three wave recovery to a lower high.
This must be visible on the hourly chart.
Certainly the extreme reading in investor bullishness fits well with todays sudden decline.
Either way, this was overdue.
For tomorrow;
Lets concentrate on building a larger impulse wave to the downside from here,
At that point we can get excited about the possibilities!
U.S CRUDE OIL
My Bias: topping in a large correction wave [4].
Wave Structure: Double combination higher in wave [4] red.
Long term wave count: wave [4] target $63 - $70
Crude corrected off the high as expected today,
the decline has not cleared up which of the current wave counts is actually correct.
Its a bit of a puzzle, but I will lay out the options.
The current operating count views the correction as either a running flat,
or an expanding flat.
The expanding flat idea requires a break of support at 63.06 to be valid.
Also,
The alternate count shows a now complete impulse wave at todays low.
Waves (i) and (ii) grey are complete and wave (iii) should follow into the $66 handle.
For tomorrow;
A further rally off todays low at 63.39 will favor the alternate wave count.
A further higher low above that level will also point to the more bullish alternate count.
Enda Glynn
http://bullwaves.org
I am an Elliott wave trader,
I have studied and traded using Elliott wave analysis as the backbone of my approach to markets for the last 10 years.
I take a top down approach to market analysis
starting at the daily time frame all the way down to the 30 minute time frame.
© 2018 Copyright Enda Glynn - All Rights Reserved
Disclaimer: The above is a matter of opinion provided for general information purposes only and is not intended as investment advice. Information and analysis above are derived from sources and utilising methods believed to be reliable, but we cannot accept responsibility for any losses you may incur as a result of this analysis. Individuals should consult with their personal financial advisors.
© 2005-2022 http://www.MarketOracle.co.uk - The Market Oracle is a FREE Daily Financial Markets Analysis & Forecasting online publication.