


Stock Index Trend Trade Setups for the SP500 & NASDAQ
Stock-Markets / Stock Index Trading Jan 22, 2018 - 07:34 AM GMTBy: Chris_Vermeulen

 Over the past few weeks, we have been writing about our US major price predictions for the beginning of 2018 and how they have played out. If you have been following our analysis, you have already learned that we predicted a 3~5% price increase in early January 2018 for most of the US major equity indexes as well as a period of brief stagnation near the middle of February. Today, we are going to revisit these predictions to attempt to provide you with our updated price expectations.
As you read this article and review our analysis, please keep in mind that we are showing you an advanced price modeling system that is capable of learning from historical price activity as well as illustrating the highest probability outcomes of price based on its analysis of key “genomic” price patters and technical patterns. The reason this is so important to understand is that we are illustrating 2~3+ month in advance based on our modeling systems interpretation of price action. Imagine having the ability to predict 2 to 3 months in advance with a relatively high degree of accuracy for any stock symbol you like? This is a very powerful analytical modeling system and we are happy to be sharing this research with our readers.
First, let’s review the SPY and the possibilities our Adaptive Dynamic Learning (ADL) price modeling system is showing us as well as how accurate the first few weeks predictions have been for 2018.
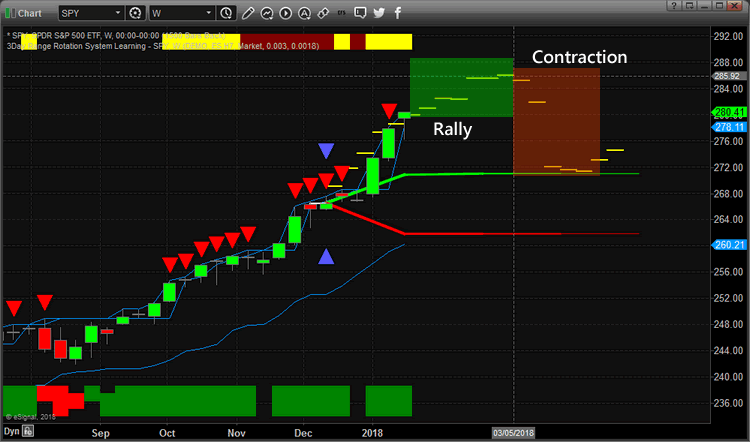
As you can see from the chart, below, our analysis on December 11, 2107 presented a series of YELLOW DASH lines that represent the highest probability outcome of price going forward. If you take a close inspection of the price levels and Yellow Dash Lines near the end of 2017, you will see that actual price levels were muted in comparison to our predicted levels. This happens when we get a brief anomaly in price action whereas price fails to meet our expectations. When this happens, most of the time price will recover to near our predicted levels at some future point in time which makes these “anomaly triggers” quite profitable. Imagine knowing that price “should be” near a certain price level but is currently 2~5% lower. Obviously, one could take a long position and wait for the equity price to simply recover to the projected price level for easy profits.
This is one reason why we believed early January 2018 would prompt a strong rally and a continued rally. The first few weeks of January 2018 were predicted to be well above $276-278 while price was hovering near $268 at the end of this year – that’s a 4% easy move.
Currently, the predicted price levels are still moderately bullish for the next 2~3 weeks before we begin a rather sharp “washout high rotation” – peaking near $285 by March 5th, 2018. This means, we should be expecting some more narrow price rallies to continue with somewhat diminishing volatility in the SPY before expecting a POP rally (really a “washout high candlestick pattern”) to form near February 15th.
After this Washout High patter forms, traders should protect longs and expect a 4~6%+ price contraction that will scare the markets. Any price contraction of more than about 5% typically frightens the markets to a degree that people start talking about “bear trend possibilities”. From the prediction of our ADL system, this looks to be a very fast and aggressive downward price swing in the SPY – so it could be news related.
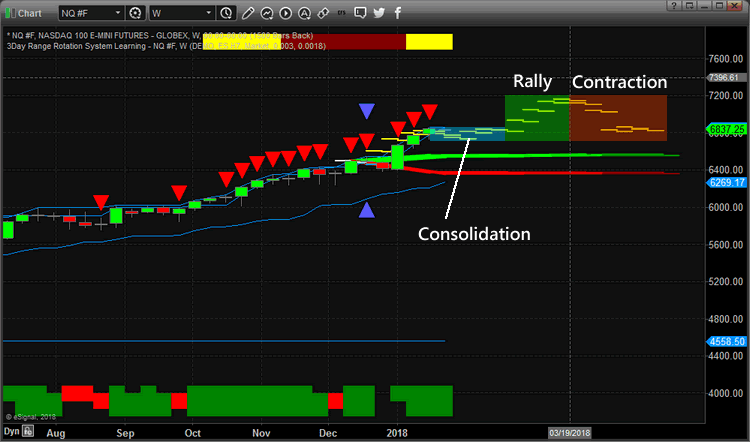
Our ADL system is predicting somewhat similar price action for the NASDAQ, yet we have a period of consolidation to get through first. As you can see from the YELLOW DASH lines originating at the same December 11, 2017 time frame, the same type of setup happened in the NQ as with the SPY. By the end of 2017, the NQ was dramatically lower ADL predicted price levels. The ADL system was predicting the NQ would reach $6725 by the end of the first week in January 2018 while the actual price at the end of 2017 was $6408 – that represents a +315 pt range. We took advantage of that “anomaly” by predicting a 3~6% rally in the QQQ ETF in the early portion of 2018 to our members.
Now that our predictions for the first part of 2018 have played out, lets focus on what is next. The ADL system is predicting a stagnation in price action for the next 4~5 weeks with narrowed volatility and rotation. We could still see some moderate volatility in price ranges, yet we expect the overall price advance to slow considerably over the next few weeks.
Somewhere near or after February 19th, we expect the NQ price to break to the upside with another 3~5% rally (again, another 350+ pt swing) that should end near March 15th and begin a dramatic downward price move. The ending prediction of the ADL system for April 23, 2018 is $6846.25 – pretty much exactly where we are at right now.
So, knowing this information and knowing that both the SPY and NQ will likely top, or present a short-term topping formation near the middle of March 2018, what should you be doing? How are you going to trade these opportunities? Do you want more of our help in understanding how to profit from these moves?
That is exactly what Technical Traders Ltd. offers to our members through the Wealth Building Trading Newsletter. Each day we provide detailed video market analysis and detailed market research to our members. We identify trends, reversals, trading setups and global market research for all our valued members. We help them find ways to profit from these moves while keeping them aware of the markets longer term objectives.
We’ve just completed the initial move of 2018. The rest of this year is sure to be full of interesting and exciting trading activity. We can’t wait to show you what happens with other asset classes and with equities after the March 2018 correction. Visit www.TheTechnicalTraders.com to see how we can assist you in profiting from these market moves. We just laid out a price map of the markets for the next 2~3 months for you to trade with. Maybe it is time you considered the value we can offer you in terms of advanced predictive analysis and more?
JOIN US NOW AND MAKE TRADING MORE PROFITABLE
CLICK HERE
Chris Vermeulen
www.TheGoldAndOilGuy.com – Daily Market Forecast Video & ETFs
www.ActiveTradingPartners.com – Stock & 3x ETFs
Chris Vermeulen is Founder of the popular trading site TheGoldAndOilGuy.com. There he shares his highly successful, low-risk trading method. For 7 years Chris has been a leader in teaching others to skillfully trade in gold, oil, and silver in both bull and bear markets. Subscribers to his service depend on Chris' uniquely consistent investment opportunities that carry exceptionally low risk and high return.
Disclaimer: Nothing in this report should be construed as a solicitation to buy or sell any securities mentioned. Technical Traders Ltd., its owners and the author of this report are not registered broker-dealers or financial advisors. Before investing in any securities, you should consult with your financial advisor and a registered broker-dealer. Never make an investment based solely on what you read in an online or printed report, including this report, especially if the investment involves a small, thinly-traded company that isn’t well known. Technical Traders Ltd. and the author of this report has been paid by Cardiff Energy Corp. In addition, the author owns shares of Cardiff Energy Corp. and would also benefit from volume and price appreciation of its stock. The information provided here within should not be construed as a financial analysis but rather as an advertisement. The author’s views and opinions regarding the companies featured in reports are his own views and are based on information that he has researched independently and has received, which the author assumes to be reliable. Technical Traders Ltd. and the author of this report do not guarantee the accuracy, completeness, or usefulness of any content of this report, nor its fitness for any particular purpose. Lastly, the author does not guarantee that any of the companies mentioned in the reports will perform as expected, and any comparisons made to other companies may not be valid or come into effect.
Chris Vermeulen Archive |
© 2005-2022 http://www.MarketOracle.co.uk - The Market Oracle is a FREE Daily Financial Markets Analysis & Forecasting online publication.