


Stock Market Double Bottom at Support
Stock-Markets / Stock Markets 2018 Jun 25, 2018 - 02:25 PM GMTBy: Andre_Gratian

 Current Position of the Market
SPX: Long-term trend – The bull market is continuing with a top expected in the low 3000s.
Intermediate trend – The intermediate correction from 2873 has ended and we are in a new intermediate uptrend which should eventually take SPX to a new all-time high.
Analysis of the short-term trend is done on a daily basis with the help of hourly charts. It is an important adjunct to the analysis of daily and weekly charts which discusses the course of longer market trends.
Daily market analysis of the short term trend is reserved for subscribers. If you would like to sign up for a FREE 4-week trial period of daily comments, please let me know at ajg@cybertrails.com
Double Bottom at Support
Market Overview
Next week, the bulls will have their best opportunity yet since the consolidation began to turn the trend in their favor. Last Tuesday, SPX had a sharp decline of about 30 points, immediately bounced off a good support level in the low 2740’s, closed in the upper part of its daily range, and retraced the rest of the decline the next morning. On Thursday, the same support was retested and held again, forming a double bottom. The retest met a short-term projection before rallying into Friday with the help of a minor cycle reversal, but it was obvious that traders were not anxious to take aggressive positions ahead of the weekend, and the index only chalked up modest gains for the day.
On Monday, another short-term cycle is expected to make its low toward the end of the day. If we should hold last week’s low, or even if we do make a slightly new low for the move but close well for the day, it would give the index a bullish tone which would intensify if 2775 were overcome. So, by Tuesday we should know if we are ready to make a new recovery high – but perhaps not a new all-time high -- right away!
Chart analysis (The charts that are shown below are courtesy of QCharts)
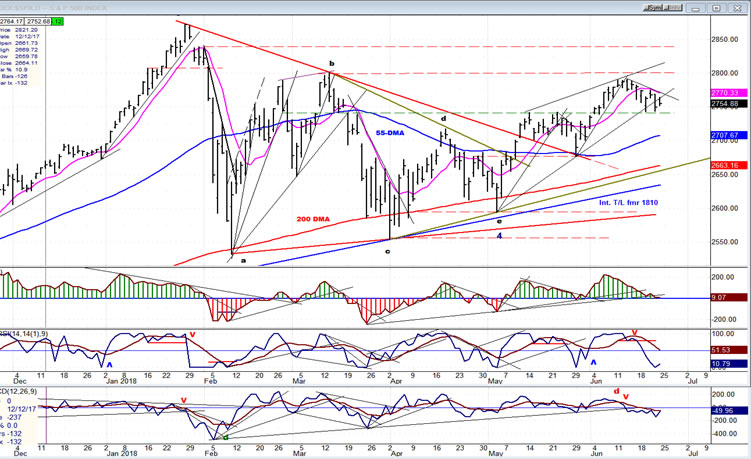
SPX daily chart
The daily chart shows clearly why this is a good support level. 2740ish was the level where previous short-term tops were created, and now that it has been retested and held for a second time, it looks like a promising area to end the correction which has been underway for the past couple of weeks. But until we can close above the short-term downtrend line on a daily basis, the issue will still be in doubt. We will also need to turn the oscillators back up, which is what they started to do on Friday; but more is needed with the two lower ones returning above the neutral line. If, on Monday, we can hold Thursday’s low for the entire day, I would expect the rally to start in earnest on Tuesday with the help of the minor cycle which should have reversed by then.
Whenever it begins, the next rally should make a recovery high, but it is unlikely that it will be able to make a new all-time high before some additional consolidation takes place. Neither the amount of congestion which formed at the previous consolidation level (2710-2740), nor the one which is forming at this level is sufficient to send us to a new high right away. More than likely, a new consolidation will start below the top red dashed line, and this could lead to something even more substantial than the correction which is presently underway
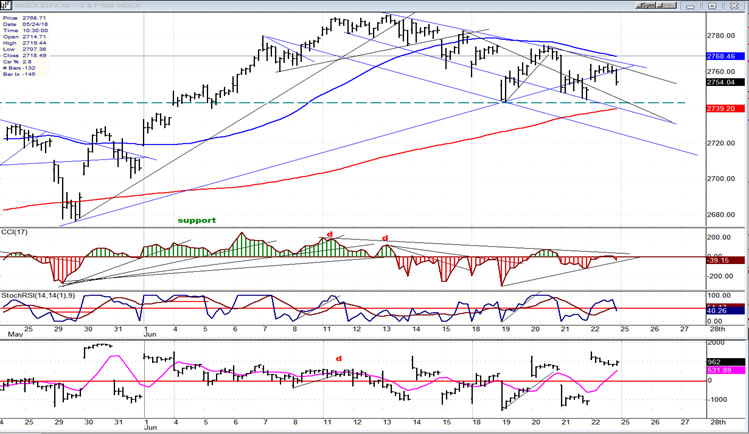
SPX hourly chart
As I pointed out above, Monday should decide whether the 2740 level holds, or if we go a little lower. Friday’s rally broke above an internal trend line, but failed to challenge the top downtrend line before turning down in the last hour. This suggests that the support level may be tested one more time, especially since there is another minor cycle ideally bottoming on Monday.
The bulls have a couple of things going for them, short-term. The cycle which bottomed on Thursday should help to counter the one bottoming on Monday. The red 233-hr MA should also contain a retracement. Finally, The A/D indicator closed strong, even going higher than the previous near-term high (positive divergence). That does not mean that we cannot go a little lower on Monday, but any decline should be confined to the 2738-40 level. (And, if the truth be known, that was the ultimate projection derived from the top congestion level if 2743-45 did not hold.) A good close on Monday should end the correction and start another uptrend that will take us to a recovery high.
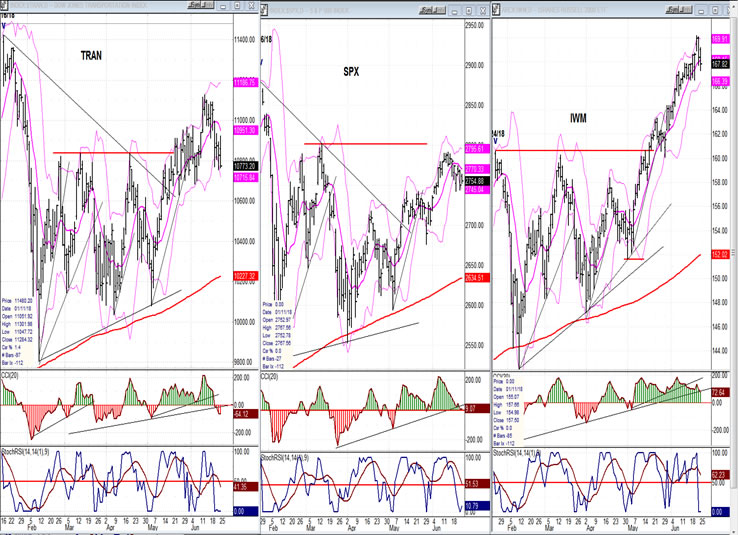
SPX vs TRAN, IWM (daily charts)
Last week, IWM did not give any ground but continued its uptrend in the face of the market correction. History suggests that SPX should soon start to follow its lead. TRAN did correct a little, but remains stronger than SPX.
UUP (dollar ETF) Weekly
UUP made a new high last week, but started to correct by Friday. No definite sign, yet, that it is ready for an important correction.

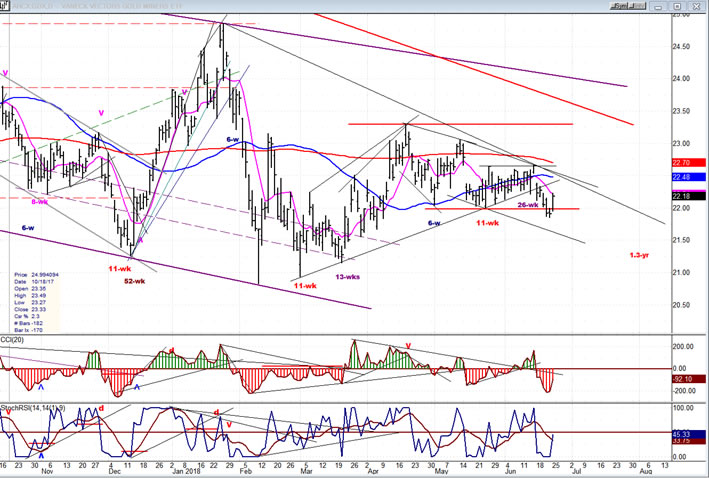
GDX (Gold miners ETF)
As long as the dollar remains strong, GDX will be confined to a consolidation pattern, at best! There are plenty of trend lines and resistance levels that will alert us to a genuine break-out when they are broken. In the meantime, GDX should continue its consolidation pattern. It’s possible that it could continue to correct until the end of July, when its 1.3 yr. cycle is due to bottom.
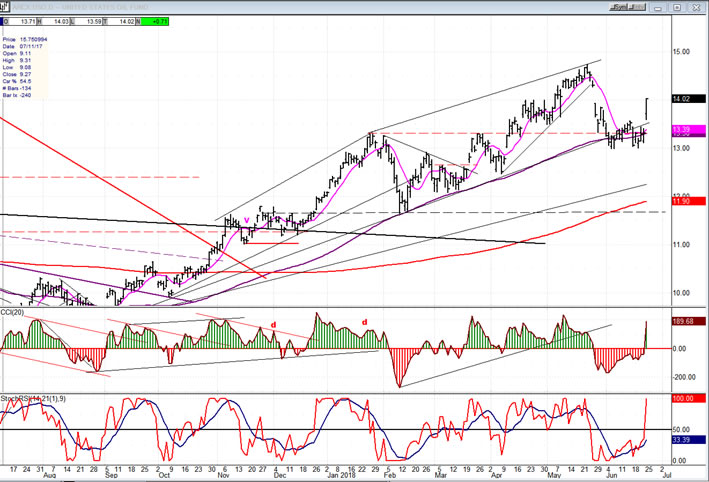
USO (United States Oil Fund)
USO held just above the dashed support line and experienced a wave of buying on Friday. Next week should tell us if it is ready to continue its longer-term uptrend or if it will need some additional consolidation. USO has a P&F target of 17.50 which should be met before it has a serious correction.
Summary
There are several factors pointing to an end of the SPX correction, providing that no substantial weakness develops over the next one or two days. If a reversal does take place, we can expect a new, but limited recovery high.
Andre
For a FREE 4-week trial, send an email to anvi1962@cableone.net, or go to www.marketurningpoints.com and click on "subscribe". There, you will also find subscription options, payment plans, weekly newsletters, and general information. By clicking on "Free Newsletter" you can get a preview of the latest newsletter which is normally posted on Sunday afternoon (unless it happens to be a 3-day weekend, in which case it could be posted on Monday).
Disclaimer - The above comments about the financial markets are based purely on what I consider to be sound technical analysis principles uncompromised by fundamental considerations. They represent my own opinion and are not meant to be construed as trading or investment advice, but are offered as an analytical point of view which might be of interest to those who follow stock market cycles and technical analysis.
Andre Gratian Archive |
© 2005-2022 http://www.MarketOracle.co.uk - The Market Oracle is a FREE Daily Financial Markets Analysis & Forecasting online publication.