Most Popular
1. It’s a New Macro, the Gold Market Knows It, But Dead Men Walking Do Not (yet)- Gary_Tanashian
2.Stock Market Presidential Election Cycle Seasonal Trend Analysis - Nadeem_Walayat
3. Bitcoin S&P Pattern - Nadeem_Walayat
4.Nvidia Blow Off Top - Flying High like the Phoenix too Close to the Sun - Nadeem_Walayat
4.U.S. financial market’s “Weimar phase” impact to your fiat and digital assets - Raymond_Matison
5. How to Profit from the Global Warming ClImate Change Mega Death Trend - Part1 - Nadeem_Walayat
7.Bitcoin Gravy Train Trend Forecast 2024 - - Nadeem_Walayat
8.The Bond Trade and Interest Rates - Nadeem_Walayat
9.It’s Easy to Scream Stocks Bubble! - Stephen_McBride
10.Fed’s Next Intertest Rate Move might not align with popular consensus - Richard_Mills
Last 7 days
Stocks Correct into Bitcoin Happy Thanks Halving - Earnings Season Buying Opps - 4th July 24
24 Hours Until Clown Rishi Sunak is Booted Out of Number 10 - UIK General Election 2024 - 4th July 24
Clown Rishi Delivers Tory Election Bloodbath, Labour 400+ Seat Landslide - 1st July 24
Bitcoin Happy Thanks Halving - Crypto's Exist Strategy - 30th June 24
Is a China-Taiwan Conflict Likely? Watch the Region's Stock Market Indexes - 30th June 24
Gold Mining Stocks Record Quarter - 30th June 24
Could Low PCE Inflation Take Gold to the Moon? - 30th June 24
UK General Election 2024 Result Forecast - 26th June 24
AI Stocks Portfolio Accumulate and Distribute - 26th June 24
Gold Stocks Reloading - 26th June 24
Gold Price Completely Unsurprising Reversal and Next Steps - 26th June 24
Inflation – How It Started And Where We Are Now - 26th June 24
Can Stock Market Bad Breadth Be Good? - 26th June 24
How to Capitalise on the Robots - 20th June 24
Bitcoin, Gold, and Copper Paint a Coherent Picture - 20th June 24
Why a Dow Stock Market Peak Will Boost Silver - 20th June 24
QI Group: Leading With Integrity and Impactful Initiatives - 20th June 24
Tesla Robo Taxis are Coming THIS YEAR! - 16th June 24
Will NVDA Crash the Market? - 16th June 24
Inflation Is Dead! Or Is It? - 16th June 24
Investors Are Forever Blowing Bubbles - 16th June 24
Stock Market Investor Sentiment - 8th June 24
S&P 494 Stocks Then & Now - 8th June 24
As Stocks Bears Begin To Hibernate, It's Now Time To Worry About A Bear Market - 8th June 24
Gold, Silver and Crypto | How Charts Look Before US Dollar Meltdown - 8th June 24
Gold & Silver Get Slammed on Positive Economic Reports - 8th June 24
Gold Summer Doldrums - 8th June 24
S&P USD Correction - 7th June 24
Israel's Smoke and Mirrors Fake War on Gaza - 7th June 24
US Banking Crisis 2024 That No One Is Paying Attention To - 7th June 24
The Fed Leads and the Market Follows? It's a Big Fat MYTH - 7th June 24
How Much Gold Is There In the World? - 7th June 24
Is There a Financial Crisis Bubbling Under the Surface? - 7th June 24

Market Oracle FREE Newsletter

How to Protect your Wealth by Investing in AI Tech Stocks

GBP/USD Remains Bearish

Currencies / British Pound Sep 04, 2018 - 03:03 PM GMT

By: FXOpen

Currencies

The daily chart of GBP/USD suggests that the pair is in a major downtrend below 1.3000 and it could decline further.

Key Points

  • The British Pound failed recently to break a crucial resistance near 1.3000/40 against the US Dollar.
  • The GBP/USD pair is following a major bearish trend line with resistance at 1.2970 on the daily chart.

GBP/USD Technical Analysis

The British Pound recently found support near the 1.2700 area and recovered against the US Dollar. The GBP/USD pair traded above the 1.2900 resistance, but it faced a major resistance near the 1.3000/40 zone.

After trading as low as 1.2660, the pair traded higher and moved above the 1.2880 and 1.2900 resistance levels. Moreover, there was a break above the 50% Fib retracement level of the last major slide from the 1.3210 swing high to 1.2660 swing low.


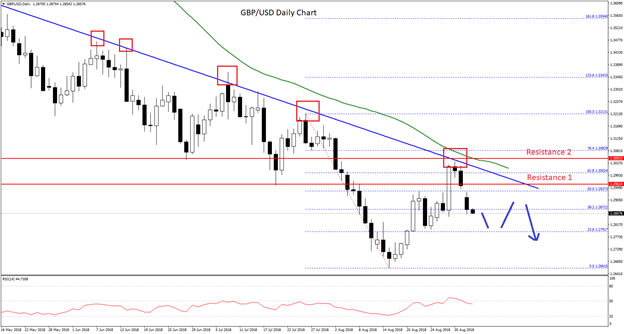
However, the upside move was capped by a significant resistance near 1.3000/40, which was a support earlier. More importantly, there pair is following a major bearish trend line with resistance at 1.2970 on the daily chart.

Above the trend line, the 50-day simple moving average is positioned near the 1.3030 level. The pair was clearly rejected from the trend line and it is currently trading below the 1.2900 support.

It seems like the pair may continue to move down towards the 1.2780 support zone, below which the pair could test the last swing low of 1.2660.

Conversely, if the pair moves higher, buyers are likely to face a strong resistance near the 1.3000 zone.

Only a successful close above 1.3030 and the 50-day SMA may perhaps push the GBP/USD pair back in a positive zone. If not, there is a risk of more losses towards 1.2660 and 1.2600.

The market outlook is provided by FXOpen broker.

FXOpen - true ECN/STP Forex and cryptocurrency broker.

© 2018 Copyright FXOpen - All Rights Reserved Disclaimer: The above is a matter of opinion provided for general information purposes only and is not intended as investment advice. Information and analysis above are derived from sources and utilising methods believed to be reliable, but we cannot accept responsibility for any losses you may incur as a result of this analysis. Individuals should consult with their personal financial advisors.


© 2005-2022 http://www.MarketOracle.co.uk - The Market Oracle is a FREE Daily Financial Markets Analysis & Forecasting online publication.


Post Comment

Only logged in users are allowed to post comments. Register/ Log in