


The Post Bubble Market Contraction Thesis Receives Validation
Stock-Markets / Financial Markets 2018 Sep 26, 2018 - 11:19 AM GMTBy: Plunger

 In the last two reports I developed the thesis that we are in the early stages of a post bubble contraction (PBC). This contraction actually began in 2008 and is now reasserting itself in the form of a global liquidity crisis (GLC). In this edition I show how this thesis just received mainstream validation and it’s now time to begin developing an investment strategy.
The FED and central banks responded to the 2008 crisis by lowering rates to zero or less and injected trillions of credit into the system. Indeed, they were able to re-inflate the pre-crisis bubble and put the contraction on hold, but only at the price of corrupting the core of money and credit itself and their actions exasperated the gap between the haves and the have nots. QE in the end turned out simply to be monetary policy for the rich. The result has been to start a world wide populist movement causing outside political contenders to win elections.
PBC Thesis get’s validated
Since the last report the PBC case chronicled here received validation from the world’s most prominent hedge fund manager – Ray Dalio.
Dalio seems to have had a bout of conscience as he enters the twilight of a very successful investment career. He just completed a 470 page book titled “A Template For Understanding Big Debt Crises”. He has offered the entire book in PDF form for free to anyone…no strings attached. He also conducted very forthright interviews on CNBC and Bloomberg which one can view on youtube.
Why would Dalio do this? After reading the book and watching the interviews it’s quite evident to me the man unequivocally sees a train wreck coming our way in the form of a PBC and it’s a warning to all of us. No doubt he will be able able to navigate the waters and make money during the crisis, but the man also wants to be able to sleep at night knowing he warned us. Thanks Ray… you are a good man.
Here is the book:
Big Debt Crisis
As a minimum, I recommend reading the first chapter up to page 65. I imagine most of you will get hooked after that and keep going. Also don’t be surprised if you find yourself thinking “Hey this is what Plunger has been talking about all year long!”—Validation!
What is Dalio really saying?
Realize who this guy is. He runs the biggest hedge fund in the world, Bridgewater Associates. He can’t just come out and say disaster is dead ahead. Hence he says this bull market is in its 7th inning and likely still has 2 years to go. If he said it was the 9th inning he would suffer redemptions and be the scourge of Wall Street. He would be like Peter Schiff who is now banned from CNBC. So he clearly is hedging his comments, but it’s my suspicion he is positioning himself for the downside right now. That may not mean shorting, but he may be using this recent move to the upside to exit long trades. I know you are going to read at least the first chapter for yourself, but below are a few salient points he makes. You may notice I have been making some of the same points for most of this year:
- 2009-2016 is the equivalent of 1929-1936. A bubble was followed by a crash. The FED then lowered rates to zero.
- Today’s market is similar to the market of 1937. Rising rates broke the market ushering in a recession.
- The next recession will have fewer stabilizers as monetary policy will exhaust quickly.
- In normal recessions, lowering rates is enough to restart the economy, but when debt reaches today’s levels it’s not enough.
- In countries with a reserve currency, like the USA, a debt deflation is the initial outcome NOT an inflationary outcome
- Initially there is a large currency devaluation of about 50% against gold.
- Aggressive money printing typically begins 2-3 years into the contraction.
- Prolonged monetization ultimately leads to the public questioning a currencies store of value function causing a flight to alternatives such as gold.
- Ultimately deploying Helicopter money runs the risk of over stimulation and may lead to hyperinflation.
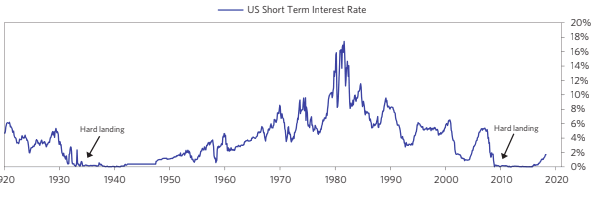
It’s not my intention to rehash the entire book as I am hoping you will read it yourself, but I would like to highlight one chart in particular; U.S. short term interest rates of the past 100 years. This chart really drives home the point that this next downturn has the potential to be catastrophic. The reason is because the FED has already shot its wad by bailing out the system over the past 10 years. He points out that recessions are cushioned by the FED lowering rates which allow the debt mountain to survive due to debt service made easier. But look how long the work out took in the 1930’s. Now take a look at how little room the FED has to maneuver this time, then consider how much more debt is in the system now.
Think of how in 2008 lowering rates to Zero wasn’t enough to rescue the system. The FED had to inject trillions into the system once rates hit zero. Next time the economy is destined to have an especially hard landing which translates to crashing asset prices. One has to wonder with only a minuscule amount of rate reductions available this time, what is going to keep all of the outstanding debt inflated in the next crisis?
2019 similar to 1937?
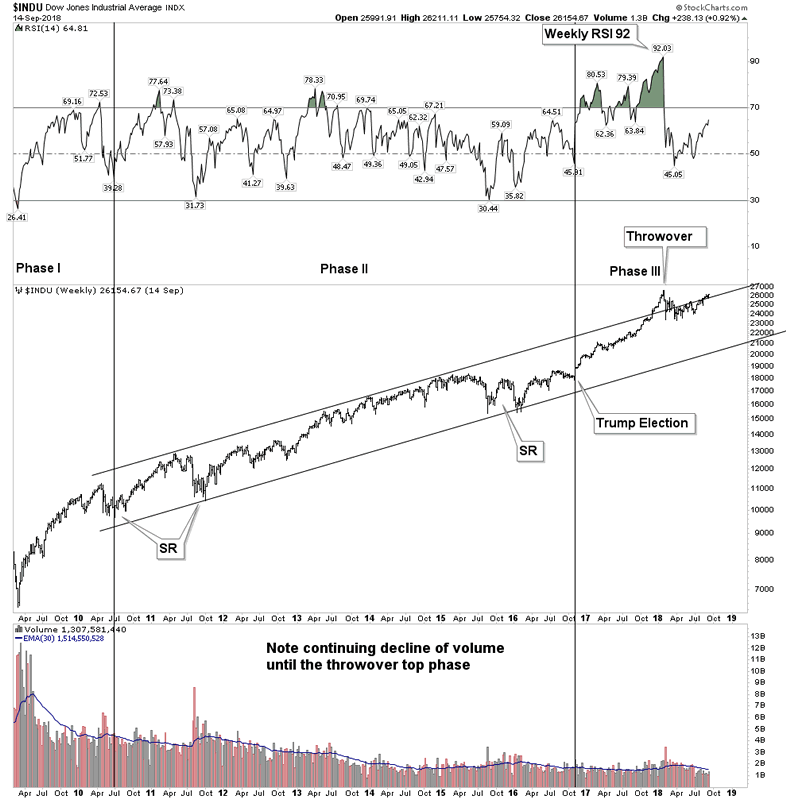
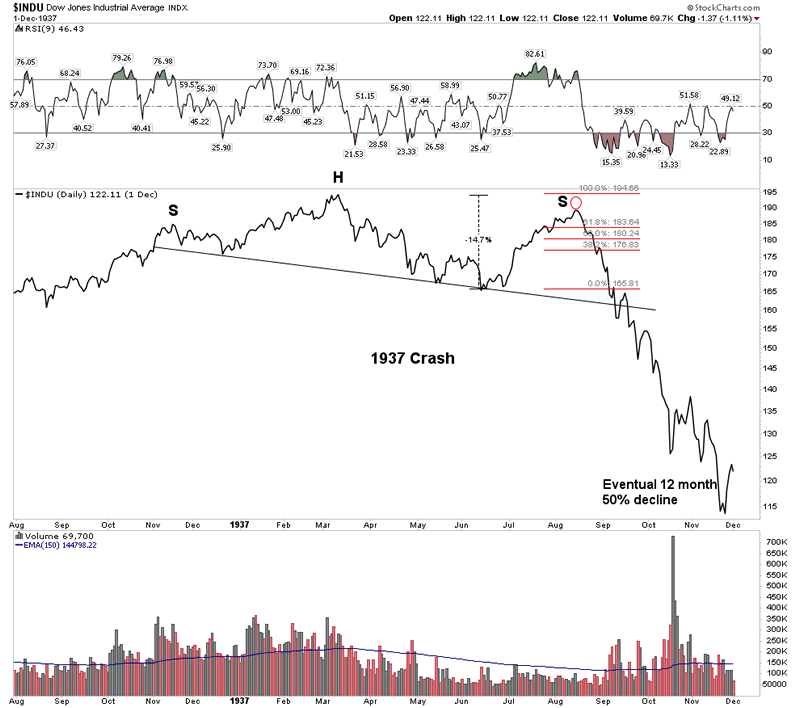
I have shown these two comparison charts before as they are instructive. The bull market from 2009 to present is eerily similar to the 1932-1937 bull market. All other bull markets rise on increasing volume as the bull gathers steam, however these two bull markets which were driven by government stimulus and financial engineering rose on decreasing volume. This was indicative of a gradual reduction of liquidity in the market. When the end came the lack of liquidity led to a violent decline of 50% over the following 12 months ending in 1938.
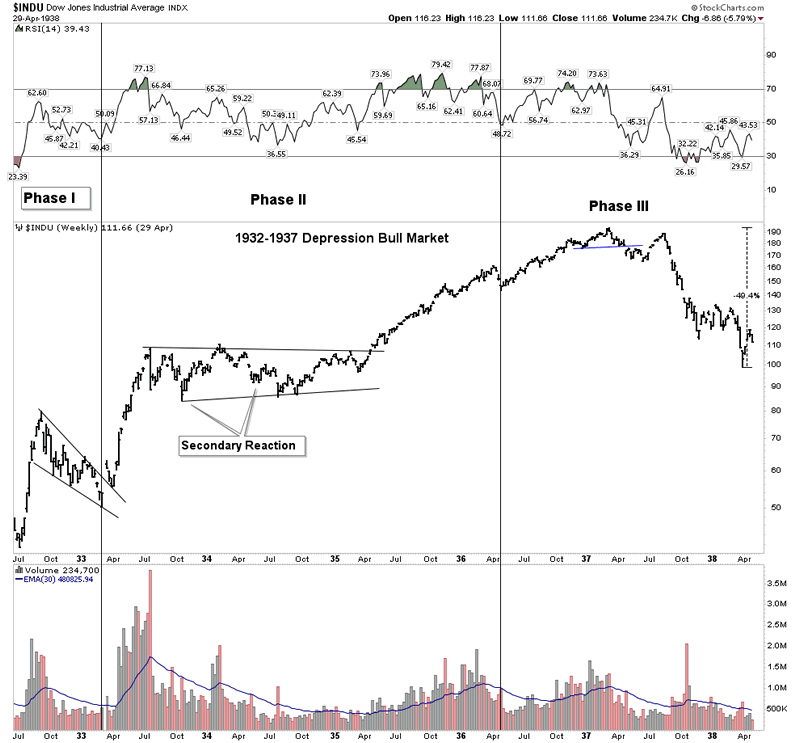
Note how liquidity was eventually drained from the market through waves of decreasing volume. Once the top was in the market lost almost 50% in one year.
Today’s bull market also shows waning volume over its entire run.
The 1937 Bear Market- Violent selling
Contrast the above bull markets with a healthy robust bull in the 1950’s. Here we see what is normal, growing organic growth in volume as the bull advances:
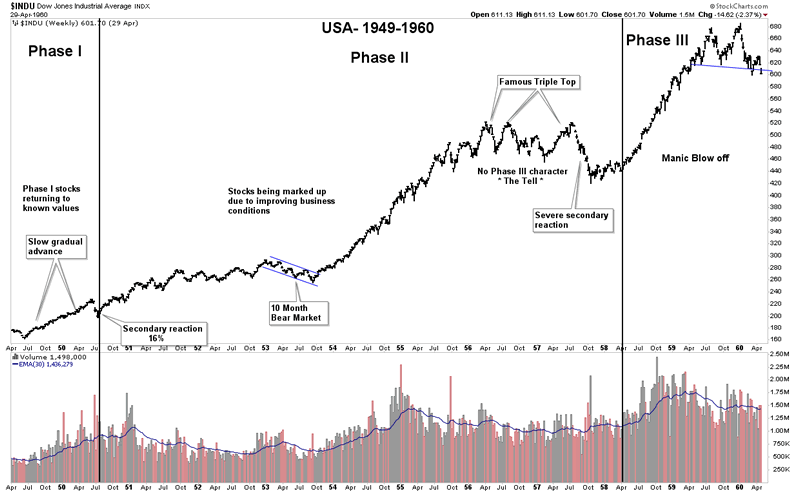
Before moving onto the next PBC subject of commodities, I would like to mention that this week the market reconfirmed that it was still in a bull market according to DOW’s Theory. The industrials went on to a new all time high within days of the Transports doing the same. It has been since January that the DOW last peaked, but for now the bull has been reconfirmed. So one might ask why is Plunger talking about an upcoming crisis when the DOW just reaffirmed an intact bull market? Simple, because its coming our way and we need to start preparing even though the DOW just hit a new high.
A Big Picture View of Commodities
The key to understanding the long term trend of commodities is hidden in the currency charts. Why is this? Because currencies ultimately indicate where money is flowing into and out of. Rambus produces the best currency charts around, however I would like to point out this concept using my own chart of the Aussie dollar.
The Australian Dollar is the principle commodity currency in the world. Since the Aussie dollar conducts a large percent of its foreign trade in the commodity sector it reflects commodity based money flows. Nearby, China consumes upwards of 50% of some commodity categories (iron ore, cement etc) and the AUD reflects the state of the commodity demand.
The Canadian Dollar is also tied closely to commodities, but it is not as pure a measure because of its proximity to the USA. When safe haven money pours into the USA some of that money spills over into Canada, so it’s not as pure of a commodity currency as the AUD is.
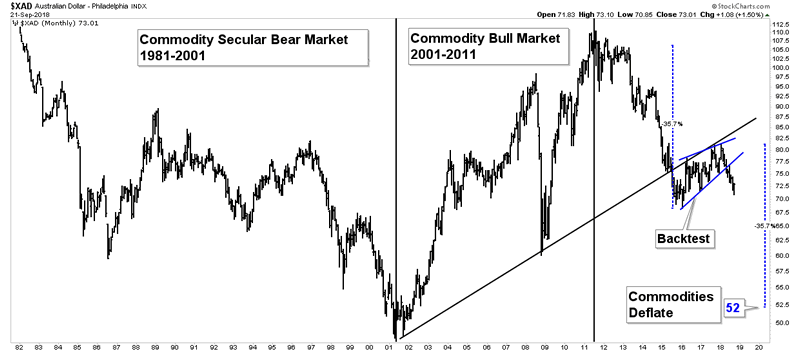
This is an amazing chart. Keep in mind you are looking at a currency and NOT commodities themselves. But it tracks the long term trends of the commodity market with precision. What it appears to be saying now is that the AUD is now finished with a 2 year back test of the upward sloping trend line. The BT was actually a rising wedge formation which may likely be a half way measured move in a trek to a PO of 52.
If this price objective is met it means commodities are headed for a massive violent fall.
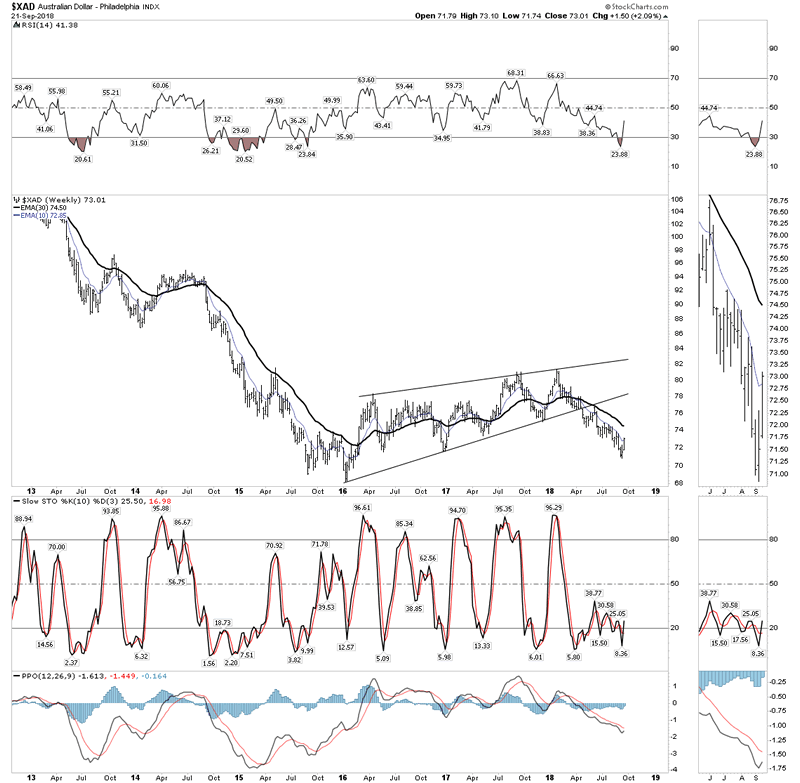
What could possibly cause this to happen? A PBC in the form of a GLC would explain it, in fact it’s the perfect prescription for such an event. Judging from the AUD’s drop already, it doesn’t appear we have those two more years to go that Ray Dalio suggests remain. Instead it appears we may be much closer to the end. Below is a close up of the backtest wedge:
CRB now setting up for a downside synchronous move?
So the Aussie Dollar serves as a lead indicator for commodities and the money flows are announcing a downside move has already started. We have seen the 2 year BT move in the AUD has now given way to a downward impulse move and commodity prices have now begun to follow. In the below chart we plot the AUD, gold, copper, oil and the CRB. We can see how the the AUD is leading the move, while oil is lagging it. Note how the secular downtrend began in 2008 for the group and they were all in a sloppy upside bounce for 2 years from 2016-2018. That bounce now seems to be over.
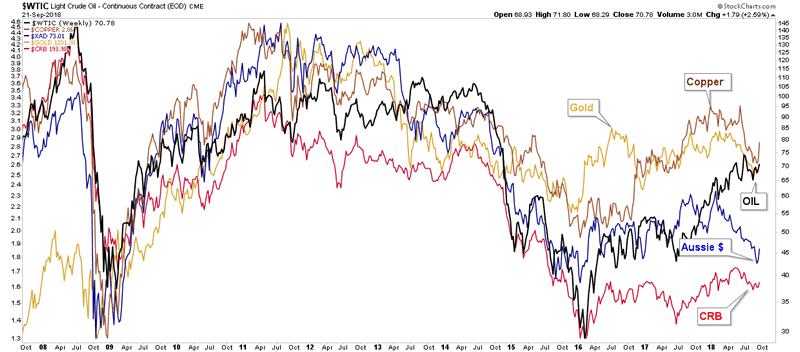
The takeaway is that the entire commodity complex has now embarked on the next cyclical bear market within the context of its long term secular bear. Once the next recession arrives this trend should accelerate. The decline we have seen so far is just the beginning of this trend.
Liquidity exiting the system – The Global Liquidity Crisis (GLC)
What Ray Dalio’s book should make clear is that the world is at the cusp of a liquidity crisis. When the crisis arrives, bids for some asset classes could literally be removed. This is the argument for commodity prices getting smashed which we will cover later in this report.
Developing a Strategy for the PBC
It appears the end is almost nigh. Dalio says 7th inning, Plunger says we are perhaps in the bottom of the 8th inning. The stock markets are likely in the final topping process now and commodities have already topped. No one knows when the final stock market top gets put in, however right before the December rate hike would be a place to look for it. Here is what we do know: typically the first sectors that top are the autos and housing. These sectors typically top at the end of the economic cycle. Both of these sectors now appear to have their tops behind them.
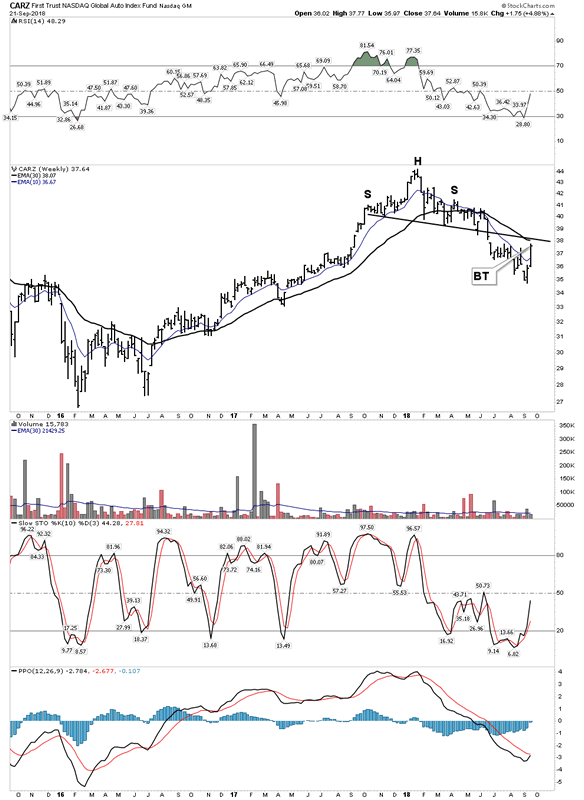
World Autos- Broken Down, Early Stages
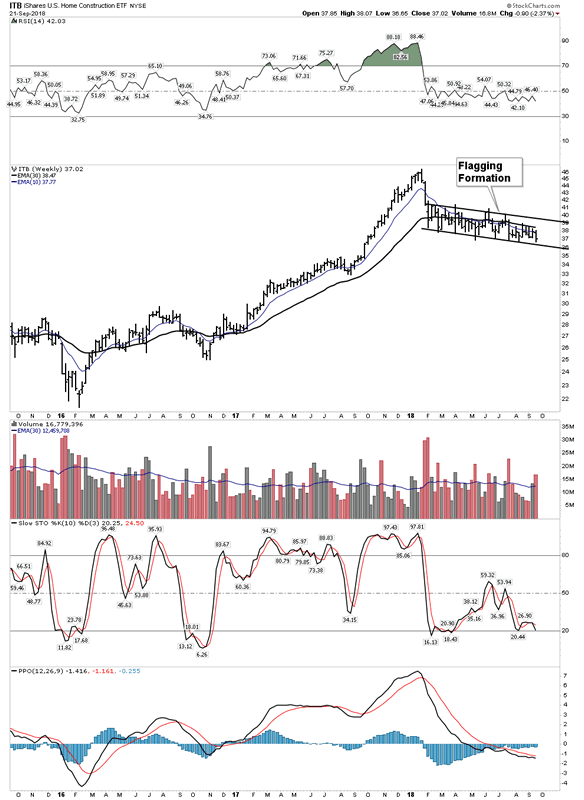
Home Builders-Setting Up for a Drop
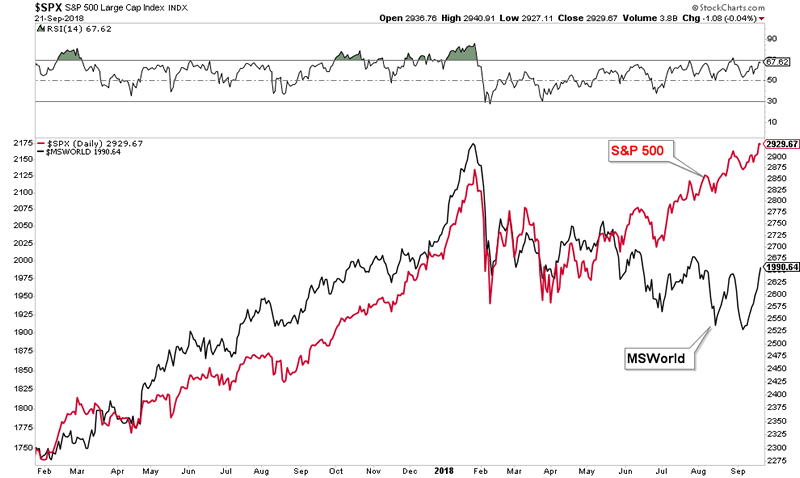
In our last PBC report we saw how markets on the world’s periphery are now well into a decline. It can only be a matter of time before the US market succumbs to these forces. In the chart below we see a clear representation of how the USA and the rest of the world are diverging. How long can this continue?
The Final Trigger
What is every hedge fund manager looking at as the final bell that they ring at the top? They are watching for the yield curve to turn up as the final trigger to exit this market.
It’s their get to the chopper indicator. It hasn’t signaled the exit yet, but once it does… take cover. When it turns up there will be a rush towards the exits. Don’t get trampled trying to get out the door.
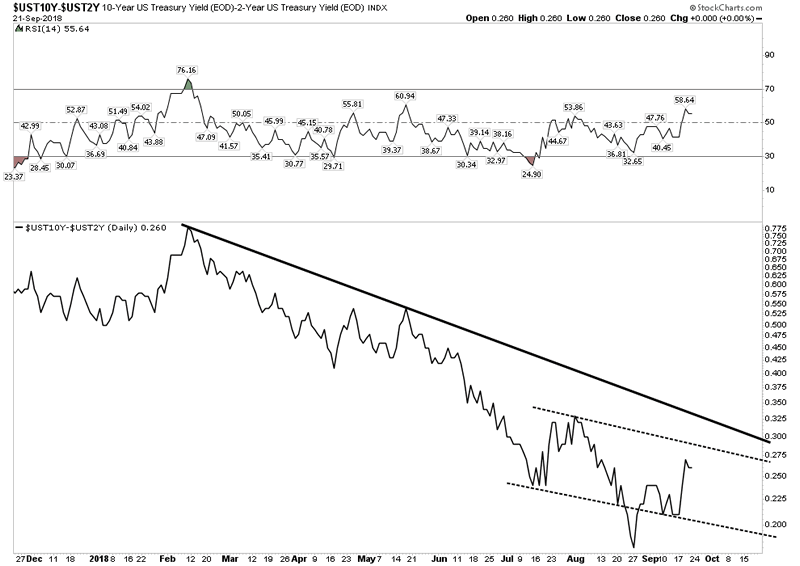
Look for a breakout above a base. Looks to me the base is in its final stages of being put in. Once the trigger gets pulled asset classes across the spectrum will be bludgeoned across the board so a short selling strategy would be appropriate, but it is not time yet. We need to wait until a top is in for the general market. Commodities however, have already topped.
Shorting the commodity sector can be considered an asymmetric trade because most people actually think commodities are in a bull market. The recent 2-year commodity rally has planted recency bias in most investors minds, they still think they are in the midst of a major bull market and we are simply in a short term pull back. Keep in mind that retail investors buy 1/3 of the way into a new bear market before they realize their mistake. Put option premiums therefore are low and the downside remains extensive as these recent investors will ultimately get flushed out.
Shorting the Major Commodity Producers
The major commodity producers are deeply cyclical and capital intensive companies. They have massive swings from cycle to cycle. If you can get the timing right one can make huge gains. If you get it wrong, you get crushed. If this analysis is correct the CRB is about to get sliced in half and the major producers should get crushed once again.
Once the bear market is over these producers will have been beaten down to ridiculously low levels providing another one of their lifetime opportunities to go long. Let’s review these classic companies as we will use them as indicators of a contraction or to trade them once a decline is confirmed then go long once the future bottom is in.
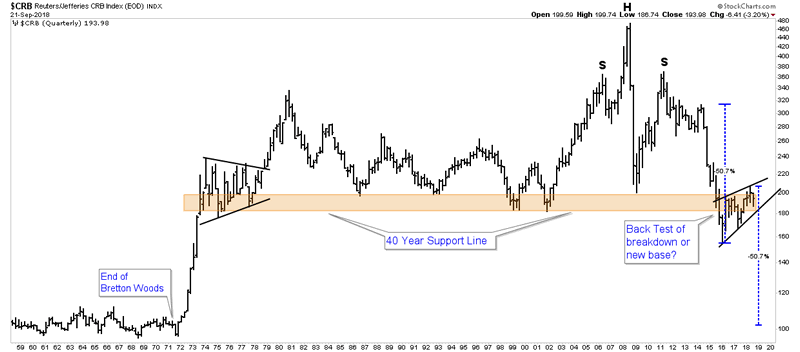
Commodities- Long Range Picture
The CRB below shows the super long view. I interpret the action since 2016 as a bearish rising wedge which is undergoing a back test to the 40 year support zone which it broke in 2015. Once this BT is complete and falls through the lower rising support line of the wedge the fall could be catastrophic as there is no support underneath. The measured move projects a 50% decline in the price of commodities….truely shocking!
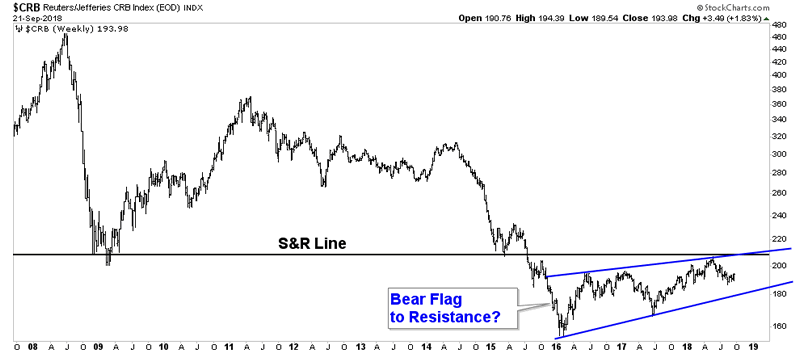
A close-up view of the 3 year back testing rising wedge shows a sickly, pathetic bounce in commodities over the past 2 years. This is a flagging formation that certainly does not take on the appearance of a new bull market.
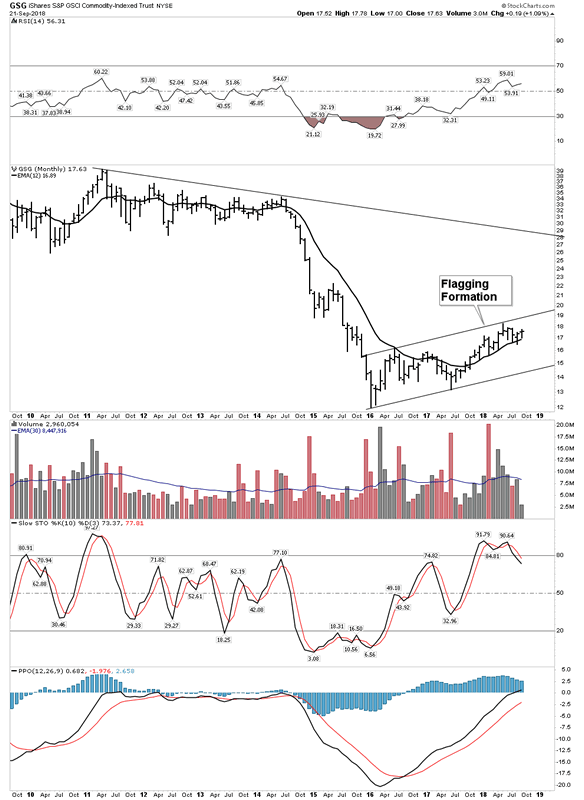
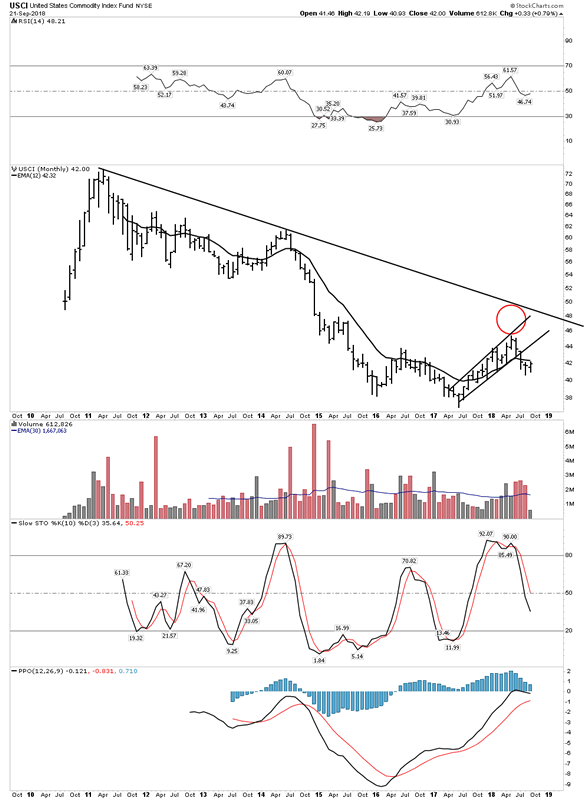
Other Commodity Indexes Confirm the same Downtrend:
We have reviewed several other commodity indexes in past reports and they all confirm this same thesis irregardless of their individual compositions. Here are some additional indexes:
GSG- I-Shares Commodities
USCI- US Commodity Fund, Broken Down.
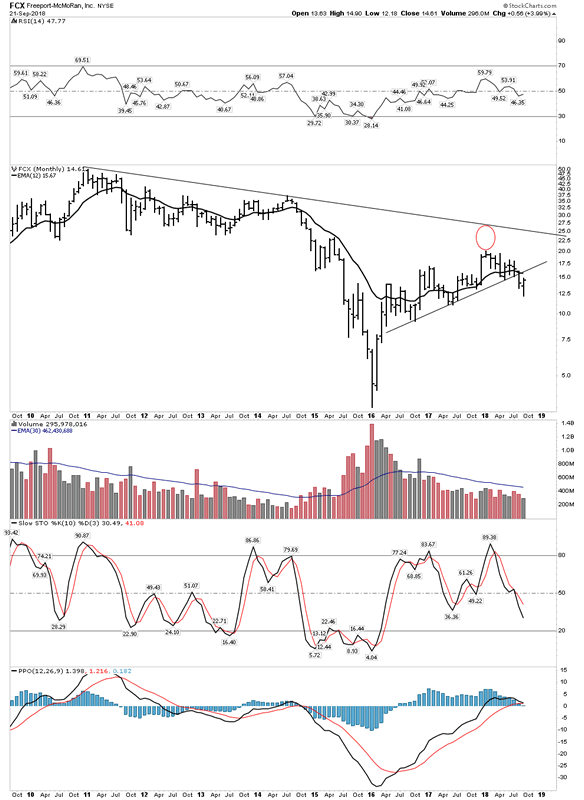
Industry Dominating Commodity Producers:
FCX– Dominant in world copper production. Deeply cyclical boom and bust company has the look of having already broken down. Look how many of these companies have taken on the chart pattern which crude oil built out from 2010-2014 prior to its collapse. An extended tilted rise supported by a S&R line that ultimately gave way.
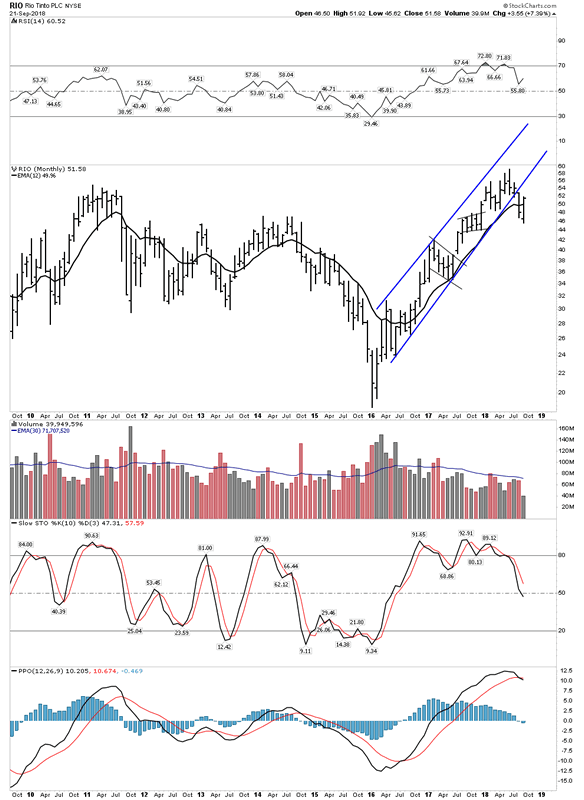
RIO Tinto– Iron Ore and base metals market dominator appears to be putting in a rolling top on the monthly chart. It has fallen out of its steep rising channel and is now engaged in a BT to the rising channel.
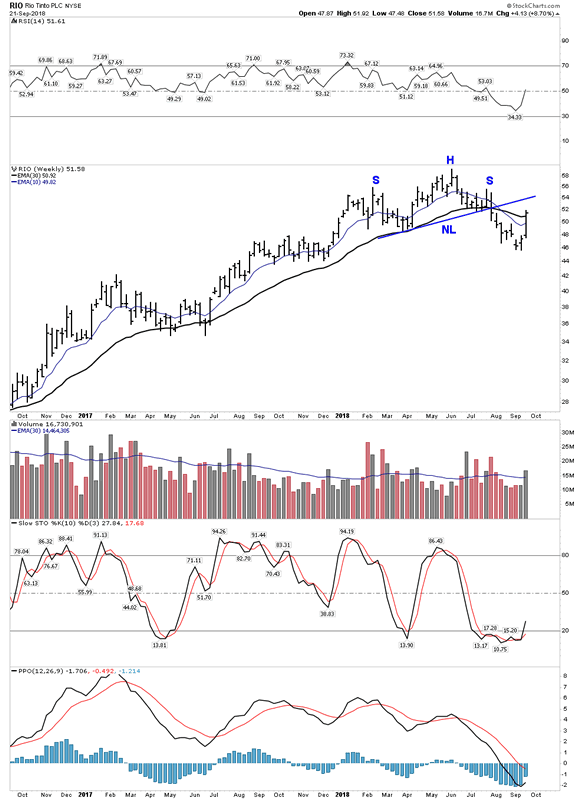
RIO’s weekly chart shows how It has broken through its H&S NL and is now flirting with a declining 30 W EMA. It appears to be early on in the process of breaking down.
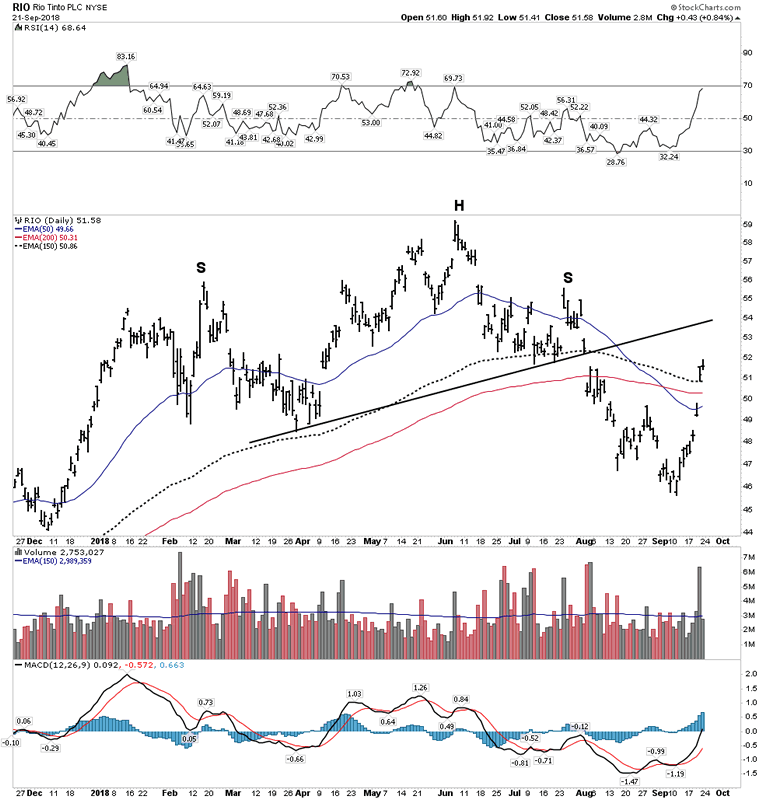
The daily chart confirms it’s in a topping process as moving averages have rolled over and price may be in an aggressive back test to the NL.
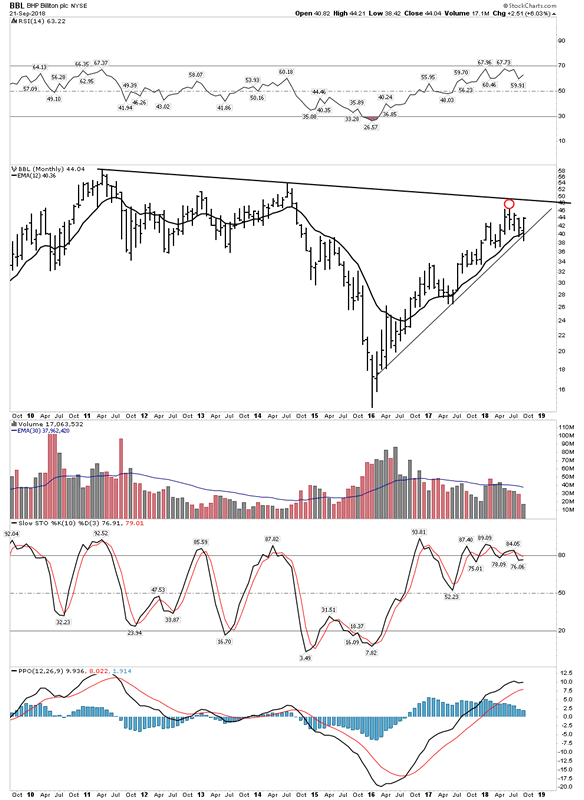
BHP– World’s Biggest Mining Company. Although its uptrend is still intact, it may be running out of steam. Watch closely for a break below its trend line and 12 M EMA to signal a more bearish view. Until then it has done nothing wrong.
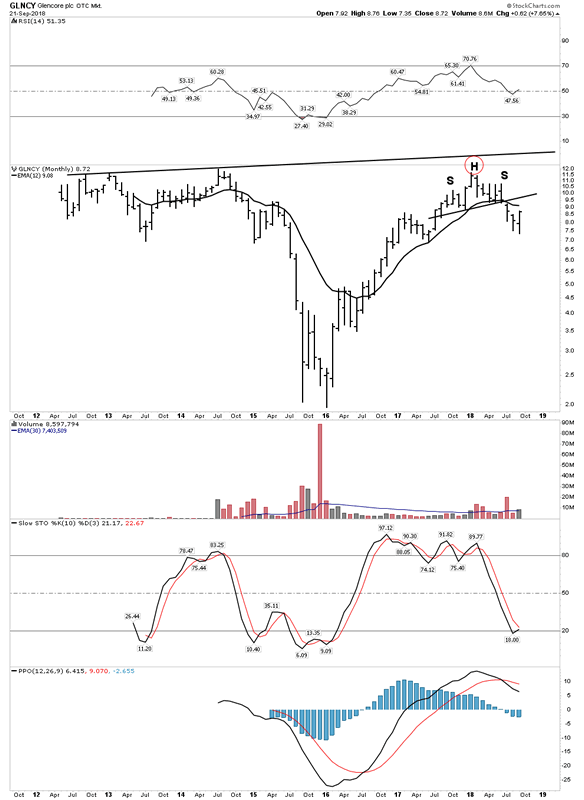
Glencore– Oil and exotic metals. This is an innovative company willing to do things and go where others refuse to go. DNC cobalt is a big product for this company. This chart looks to have clearly peaked. It is famous for wild swings.
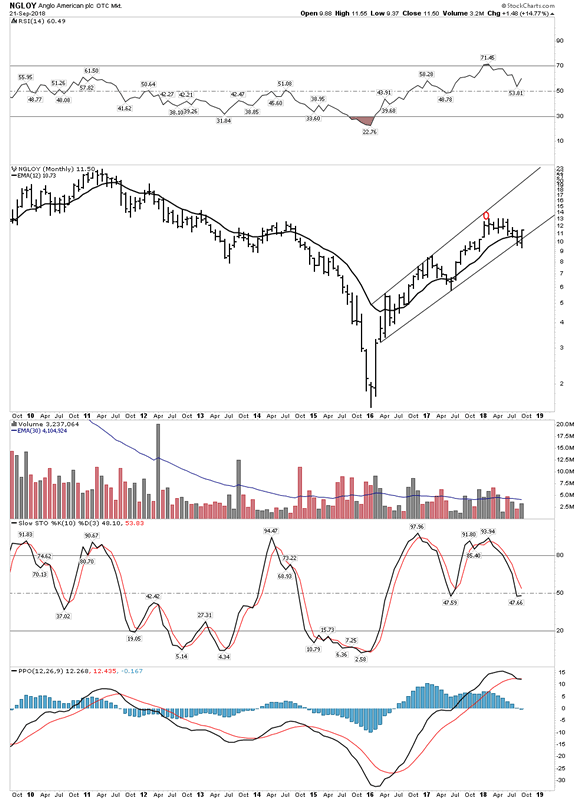
Anglo American- Precious metals wrap up. This company does it all, gold, diamonds, PGM group metals, coal, iron ore, copper. The company has world wide operations.
Their PGM output is close to 50% of world production so this company is very sensitive to autos and world economic growth. It is “the one” to watch as an indicator of the health of world economies and is famous for its huge percentage moves both up and down.
Presently the monthly chart appears to be hanging on but only by its finger nails:
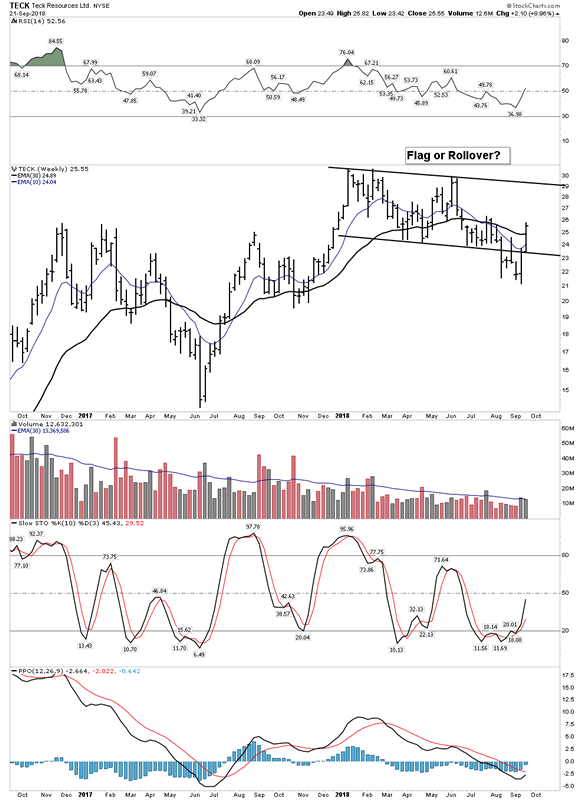
TECK Resources– Large Canadian broad resource company appears to be in its final stages prior to a industry break down.
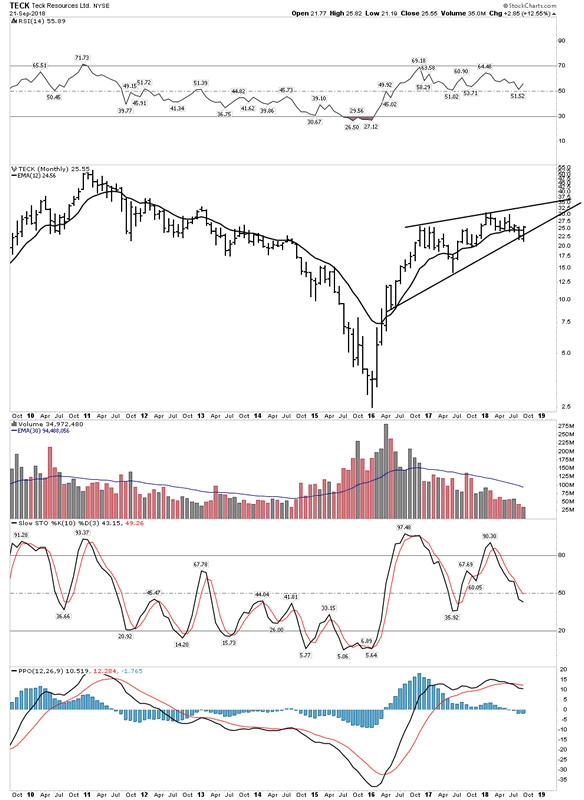
The weekly shows it may be in the process of rolling over:
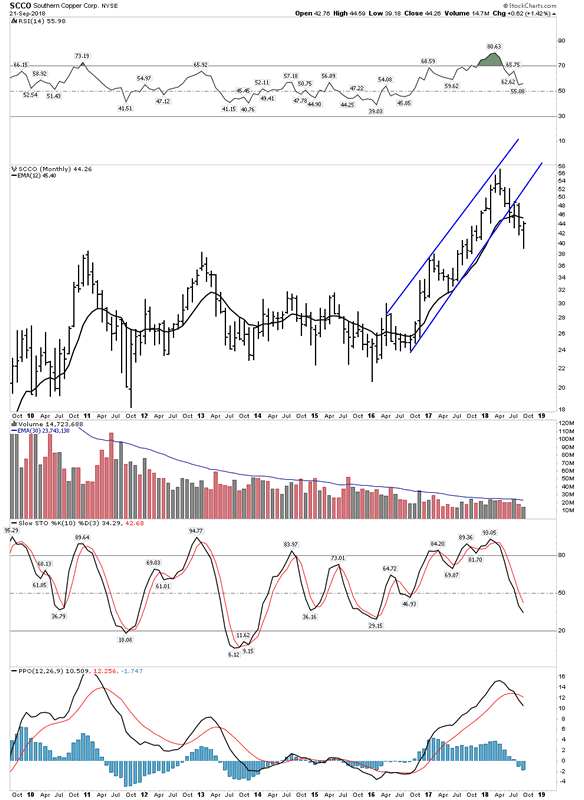
SCCO- Chilean Massive Copper Producer, has now broken down and is no longer in a bull market:
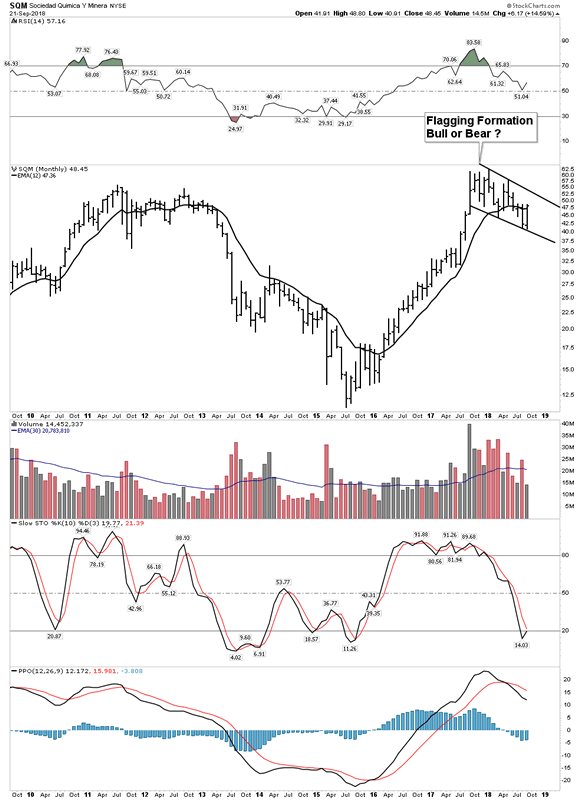
SQM– Lithium Production. Bull Flag or Bear Flag? It is struggling to stay above its 12 M EMA. We will see if the Lithium boom is over:
Conclusion
The message of these charts is that across the spectrum the commodity sector seems to have flamed out, but its early in a downtrend. In the short term it is currently bouncing higher in a retracement to its recent breakdown. The two year commodity rally got everyones juices flowing and claims of a long term commodity bull market were pronounced from every mountain top. The consensus continues to be a long term bull market lies ahead, but the charts are pointing in the opposite direction. In fact, they seem to be validating the PBC thesis which is just now reasserting itself after laying dormant for the past 9 years as the FED and central banks aggressively intervened. As the GLC asserts itself liquidity will be removed from markets and prices could experience a violent bear market similar to what occurred in 1937. This helps explain how the CRB index could literally be cut in half in a short period of time.
It seems the non-consensus big money bet will be to position oneself for the downside. In the meantime we have a model from which to view the process from. It has already began at the periphery of the world’s economy and is now moving towards the major markets of the world. Meanwhile safe haven money moves towards the core resulting in the USA hitting new highs. Yesterday, another domino dropped in India:
http://www.zerohedge.com/news/2018-09-22/tic-tac-toe-indias-npl-crisis-about-blow
The clock is ticking.
Addendum:
Uranium Update
Uranium stocks have performed quite well lately having rocketed off their well formed bottoms as of late. Many of us find themselves planted well on the sidelines looking in afraid to touch this sector because it has burned so many in the past. Here are my thoughts for this group.
We don’t know yet if this is the start of an actual sustained bull market, but each day it does take on the appearance of one. We will need more backing and filling to know for sure. But the big gains come from those who get in early. This is what occurred in the previous bull market which began in the early 2000’s. If one missed the first year he missed the big percentage gains. Keep in mind this sector underwent a 96% collapse of its industry market cap, so it has been well beaten down and even though the stocks have run somewhat at this point they still sport very small market caps. Compare Energy Fuels (UUUU) with cannabis crazed Tilray (TLRY) which is only 2 months old. UUUU= $280 M vs. TLRY= &11.5 B.
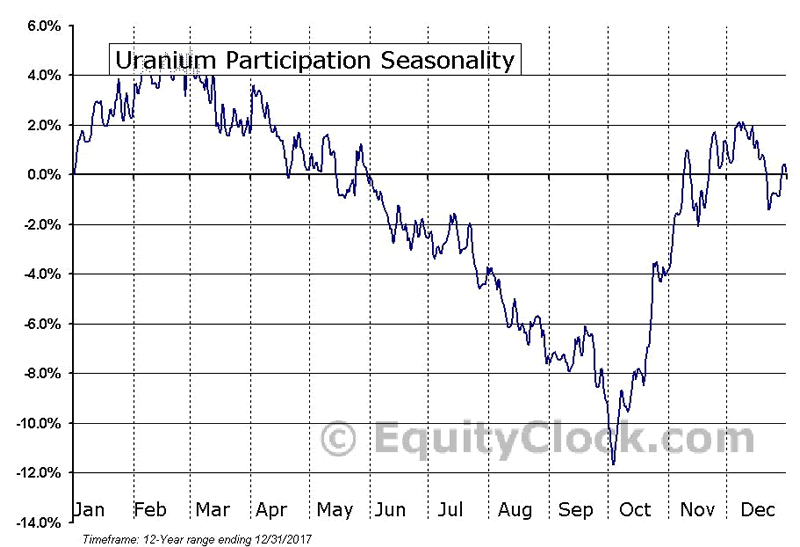
I have mentioned several times before that the uranium sector offers us the best risk reward proposition of anything in my lifetime for long term investors. So here is a nugget of insight I offer… seasonality. No guarantee, however starting in October the wind will be at your back for uranium plays. Rarely have I ever seen such a biased time zone to be in a market sector than what lies ahead over the next two months. Virtually most of the gains are registered in the months of October and November.
Plunger
Plunger is Rambus Chartology’s Resident Market Historian and an associate writer. For a complete compilation of his work members can check the “Plunger” Tab .
Copyright © 2018 Plunger - All Rights Reserved
All ideas, opinions, and/or forecasts, expressed or implied herein, are for informational purposes only and should not be construed as a recommendation to invest, trade, and/or speculate in the markets. Any investments, trades, and/or speculations made in light of the ideas, opinions, and/or forecasts, expressed or implied herein, are committed at your own risk, financial or otherwise. The information on this site has been prepared without regard to any particular investor’s investment objectives, financial situation, and needs. Accordingly, investors should not act on any information on this site without obtaining specific advice from their financial advisor. Past performance is no guarantee of future results
© 2005-2022 http://www.MarketOracle.co.uk - The Market Oracle is a FREE Daily Financial Markets Analysis & Forecasting online publication.