


Will Crude Oil Follow Historical Patterns?
Commodities / Crude Oil Oct 09, 2018 - 08:52 AM GMTBy: Chris_Vermeulen

Our research team, at Technical Traders Ltd., has been very interested in Oil recently as the current rally appears to have rotated lower near a top. Our predictive modeling systems, predictive cycle analysis and other tools suggest Oil/Energy may be setting up for a downward price trend. This may be an excellent opportunity for skilled traders to identify profitable trades as this trend matures.
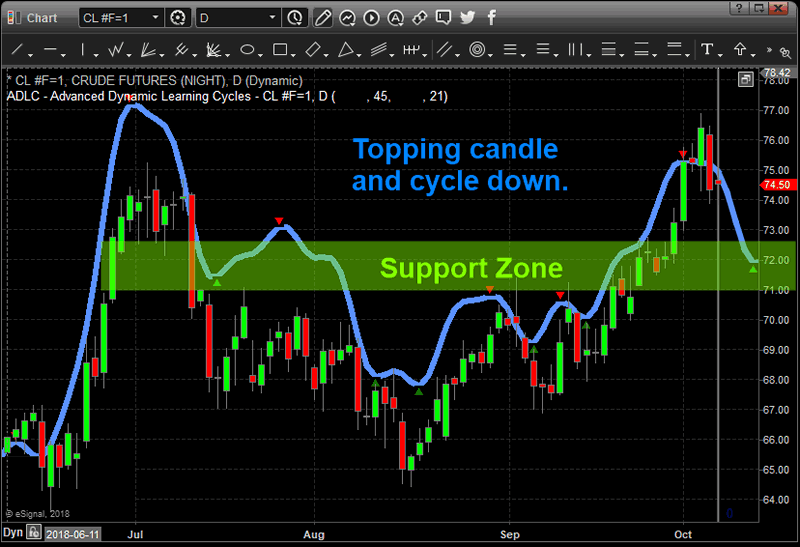
This Daily Crude Oil Chart shows our Predictive Cycle Modeling system and shows the projected price cycles out into the future. One can see the downside projected price levels very clearly. This cycle analysis tool does not predict price levels, it just predicts price trends. We can’t look at this indicator and think that $72 ppb is a price target (near the right side). We can only assume that a downward price cycle is about to hit and use historical price as a guide to where price may attempt to fall to.
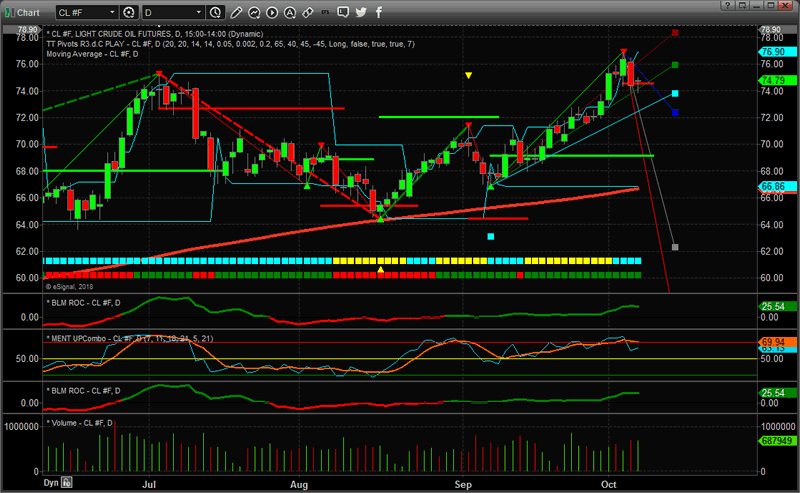
Using our adaptive Fibonacci price modeling tool, we can see from the chart below that downside price targets are currently near $72 ppb, $67 ppb and $65 ppb. Therefore, we believe the $72 price level will become the first level of support, where our price cycle tool suggests a small rotation may occur, and the $67 price level may become the ultimate downside target level.
We believe the current price rotation in Oil/Energy may be setting up for a decent downside price move with a lower price target at or below $67 ppb. Historical data shows that this type of price action, downward, at this time is historically accurate and predictable. If you want to know how you can profit from this move and learn how our research team continues to find and execute superior trades for our members, visit www.TheTechnicalTraders.com to learn more.
Chris Vermeulen
www.TheTechnicalTraders.com
Chris Vermeulen has been involved in the markets since 1997 and is the founder of Technical Traders Ltd. He is an internationally recognized technical analyst, trader, and is the author of the book: 7 Steps to Win With Logic
Through years of research, trading and helping individual traders around the world. He learned that many traders have great trading ideas, but they lack one thing, they struggle to execute trades in a systematic way for consistent results. Chris helps educate traders with a three-hour video course that can change your trading results for the better.
His mission is to help his clients boost their trading performance while reducing market exposure and portfolio volatility.
He is a regular speaker on HoweStreet.com, and the FinancialSurvivorNetwork radio shows. Chris was also featured on the cover of AmalgaTrader Magazine, and contributes articles to several leading financial hubs like MarketOracle.co.uk
Disclaimer: Nothing in this report should be construed as a solicitation to buy or sell any securities mentioned. Technical Traders Ltd., its owners and the author of this report are not registered broker-dealers or financial advisors. Before investing in any securities, you should consult with your financial advisor and a registered broker-dealer. Never make an investment based solely on what you read in an online or printed report, including this report, especially if the investment involves a small, thinly-traded company that isn’t well known. Technical Traders Ltd. and the author of this report has been paid by Cardiff Energy Corp. In addition, the author owns shares of Cardiff Energy Corp. and would also benefit from volume and price appreciation of its stock. The information provided here within should not be construed as a financial analysis but rather as an advertisement. The author’s views and opinions regarding the companies featured in reports are his own views and are based on information that he has researched independently and has received, which the author assumes to be reliable. Technical Traders Ltd. and the author of this report do not guarantee the accuracy, completeness, or usefulness of any content of this report, nor its fitness for any particular purpose. Lastly, the author does not guarantee that any of the companies mentioned in the reports will perform as expected, and any comparisons made to other companies may not be valid or come into effect.
Chris Vermeulen Archive |
© 2005-2022 http://www.MarketOracle.co.uk - The Market Oracle is a FREE Daily Financial Markets Analysis & Forecasting online publication.