


A Post-Powell View of USD, S&P 500 and Gold
Stock-Markets / Financial Markets 2018 Dec 02, 2018 - 06:05 PM GMTBy: Gary_Tanashian

 The Fed blinked. This was not news to Macro Tourist Kevin Muir or readers of Biiwii.com, which is very pleased to publish his work.
Amid a weakening global economy, gathering signs of weakening in the US economy and a dump in inflation expectations, Jerome Powell implied that the Fed may be going on hold for a while after a December rate hike.
This graph from SG Cross Asset Research/Equity Quant by way of Kevin Muir’s article attempts to show that the accumulated rate hike tightening and “shadow” tightening as a result of QE suspension has now met or exceeded the levels that preceded the last two economic recessions.
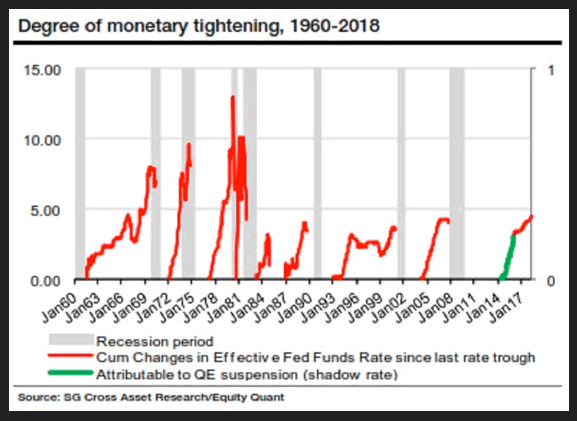
Add in very high profile haranguing by Donald Trump, the above-noted drop in inflation expectations and economic weakening (that began with our Semi sector signals nearly a year ago) and it sure is not surprising that the Fed may take its foot off the break for a while, and possibly a long while.
So what is expected of our two main themes, the cyclical and risk ‘on’ stock market and the counter-cyclical and risk ‘off’ gold and the miners, which leverage gold’s counter-cyclical utility? Let’s check in after this week’s events.
US Dollar
Just a few words here and no charts. The daily chart is trending up with some negative divergence, the weekly sports a fairly bullish pattern that has not yet activated by exceeding its neckline and the monthly chart shows that USD has been rallying in 2018 after finding key long-term support and has been in a cyclical bull market since 2011, when the last big inflation trade blew out.
Powell’s jawbone was (probably not intentionally) aimed squarely at the strong dollar, which many currency watchers consider to be over valued, given the current state of US policy tightening vs. limited potential for further tightening. But with the world’s reserve currency, I would have caution about such automatic and linear thinking. One real asset market implosion and USD would likely get a liquidity bid that would be a real humdinger.
But in the near-term, if USD does sell down due to policy expectations several US sectors, global markets (still down trending) and commodities (technically broken) should benefit, for a hearty bounce at least.
S&P 500
In a post yesterday we outlined a near-term bullish prospect for the S&P 500 that could precede a decidedly bearish prospect in the first half of 2019. The recent downside in the stock market and subsequent bounce has created some pretty nasty pattern potential on SPX. What’s more, the would-be pattern measures to the favored SPX target for H1 2019, which is the 2100 to 2200 area, which is a massive support zone.
Now, anyone can draw a would-be Head & Shoulders on a chart and scare you with it. But one thing I find interesting is that the potential H&S forming now measures to the very downside target we’ve had in view for 2019. This target could simply be a massive buying opportunity, but most will think it is a bear market if it comes about. Buyers would need panic sellers, after all. I should note that I am not predicting anything here. Not that the market will crash to 2100 and not that it will stop there. It’s just probabilities subject to incoming information, folks.
What I find even more interesting than the pattern’s measurement is something that is key to a bearish H&S. That something is negative divergence in momentum at the higher high AKA the Head. Look at how badly MACD and RSI diverged the new highs after the summer grind upward.
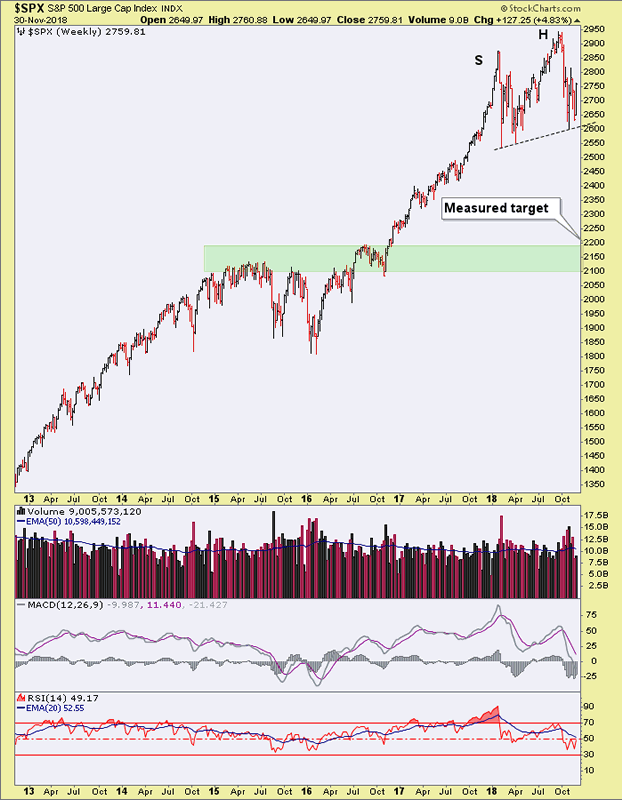
But this is a weekly chart and it would need time to form a theoretical right shoulder and that formation would include further short-term upside.
And a problem for the bears on the short-term had been the over bearish sentiment knee jerk brought on by the October correction. Here is the picture from Sentimentrader by way of NFTRH 527, with my markups. As of last weekend this was a picture of a sentiment setup that was sooner or later going to launch a bounce. Enter the Powell jawbone and a big time pressure release. For reference, see this post made just before Powell emerged. The media were tending ’em all bearish: Why a Bounce?
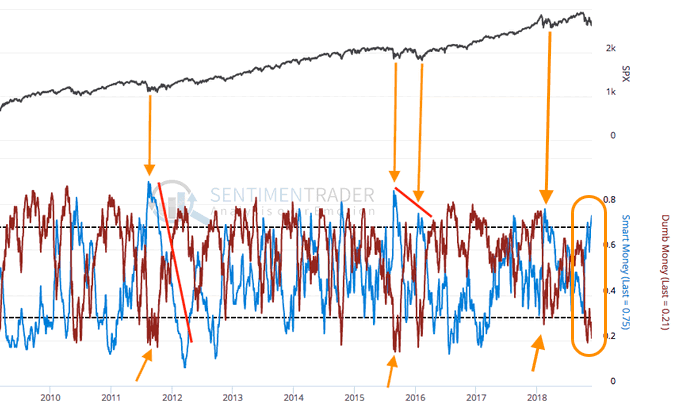
Given that the November and December seasonal averages are relatively bullish, the prospect of a sentiment-induced bounce back rally has been in play. This morning we looked at the progress of the XLY/XLP ‘internals’ indicator as well.
So our bottom line is that to build out a right shoulder to a bearish Head & Shoulders the stock market needs to rise a bit more and it appears to need a few weeks of bullish grinding if it is to be in symmetry with the pattern’s left side. Also, the level of over bearish sentiment will not be cleaned up overnight even if the stock market continues to bias upward. So it could be several weeks of halting recovery. And that is just perfect because our plan all along had been for very bearish potential in H1 2019, more so than Q4 2018.
From the technical (would-be) pattern build out to sentiment to seasonality, it appears the ducks are lining up in a nice row.
Gold & Gold Stocks
In the mirror to the fun and risk ‘on’ games that the S&P 500 has embodied all these years has been the gold sector. For reasons related to much of the above I am unapologetically fundamentally bullish on the gold sector for 2019. Why, the drive-by barbs I’ve gotten for daring to write bullish things about this sector that everyone knows is bearish have only strengthened the view that this is the sector in waiting for the macro to finally go counter-cyclical.
But as noted to NFTRH subscribers in an update yesterday when presenting a near-term bullish, longer-term bearish stock market view…
What might this mean for the gold sector? It could mark and bide time during the making of a right shoulder [on SPX], preparing to get bullish when it fails (again, we’re theorizing here) or it could take a final dump if bullish risk ‘on’ spirits are sufficiently renewed.
The fundamentals have done nothing but improve, save for a holdout and still-flattening 10-2 yield curve (the 30-5 is a different story) but as we have also been noting, the technicals have been flat out bad. I consider this the result of another tax loss selling season for the ignominious sector and the fact that the average gold bug sees declining inflation expectations and thinks “I’d better sell gold and the miners!”.
I’ve spent too much virtual ink writing about why that is the wrong kind of thinking, but don’t get in the way of gold bugs when they are selling for the wrong reasons or buying for the wrong reasons (like inflation). It has to play out. You buy the gold sector amid tanking inflation expectations.
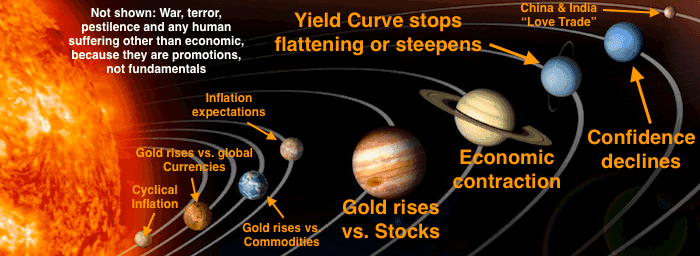
Meanwhile, I’ll leave you with the handy picture worth 1000 words. You can dig up some of my recent articles here at nftrh.com if you’d like to review the fundamental details.
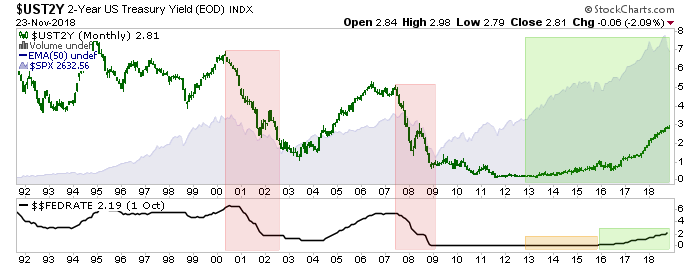
Powell’s concession that policy may have tightened to a stress point is in line with the favored (for the gold sector) counter-cyclical view. Here we cue the 2 year yield and Fed Funds rate as correlated with the last two major stock market tops. Here is a chart as presented in NFTRH 527 before the Powell jawbone, making the point that he may well have signaled that a clock is ticking…
Time to get a little relaxation in before starting NFTRH 528 tomorrow morning. It should be an interesting read and hopefully, enjoyable to write. Things are in motion, after all.
Subscribe to NFTRH Premium (monthly at USD $33.50 or a 14% discounted yearly at USD $345.00) for an in-depth weekly market report, interim market updates and NFTRH+ chart and trade setup ideas, all archived/posted at the site and delivered to your inbox.
You can also keep up to date with plenty of actionable public content at NFTRH.com by using the email form on the right sidebar and get even more by joining our free eLetter. Or follow via Twitter ;@BiiwiiNFTRH, StockTwits or RSS. Also check out the quality market writers at Biiwii.com.
By Gary Tanashian
© 2018 Copyright Gary Tanashian - All Rights Reserved
Disclaimer: The above is a matter of opinion provided for general information purposes only and is not intended as investment advice. Information and analysis above are derived from sources and utilising methods believed to be reliable, but we cannot accept responsibility for any losses you may incur as a result of this analysis. Individuals should consult with their personal financial advisors.
Gary Tanashian Archive |
© 2005-2022 http://www.MarketOracle.co.uk - The Market Oracle is a FREE Daily Financial Markets Analysis & Forecasting online publication.