


Stock Market’s Medium Term is No Longer Bullish. It is Now Mixed
Stock-Markets / Stock Markets 2019 Jan 18, 2019 - 04:00 PM GMTBy: Troy_Bombardia

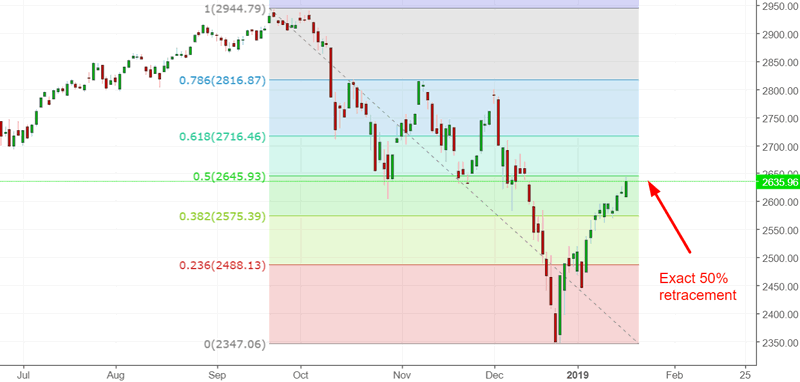
Now that the S&P 500 has reached its 50% fibonacci retracement, its medium term outlook is no longer decisively bullish. As we mentioned before, 13 of 15 historical 20% declines saw a pullback/retest after a 50% retracement.
Go here to understand our fundamentals-driven long term outlook.
Let’s determine the stock market’s most probable medium term direction by objectively quantifying technical analysis. For reference, here’s the random probability of the U.S. stock market going up on any given day.

*Probability ≠ certainty. Past performance ≠ future performance. But if you don’t use the past as a guide, you are blindly “guessing” the future.
Long term macro
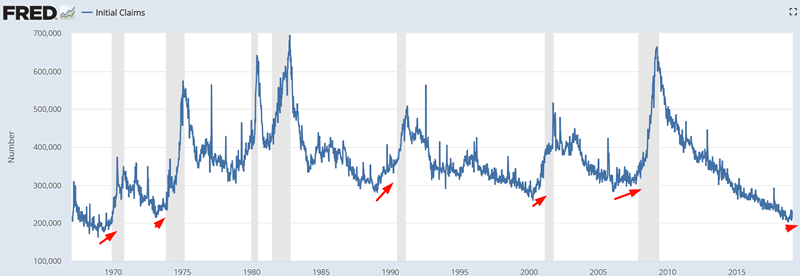
The stock market’s biggest long term problem is that as the economy reaches “as good as it gets” and stops improving, the long term risk is to the downside.
For example, Initial Claims are extremely low right now, and have been trending sideways for most of the past year.
Here’s what happened next to the S&P when the 3 month moving average for Initial Claims is higher than where it was 3 months ago, while the S&P is under its 200 dma and Initial Claims is under 300k (i.e. late cycle).
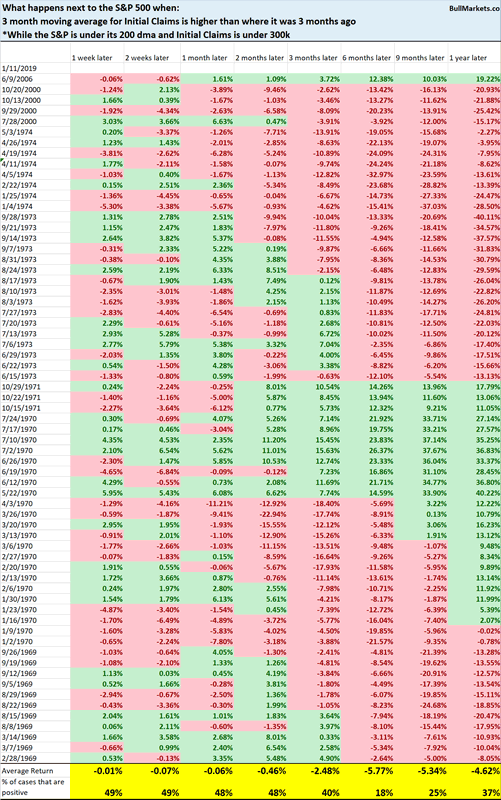
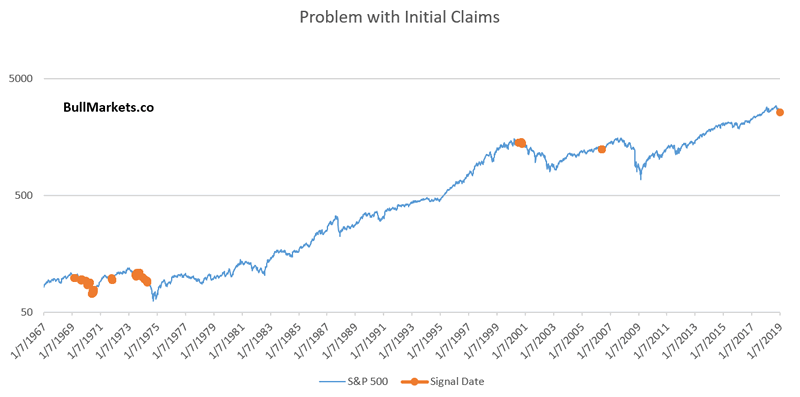
As you can see, the S&P’s long term forward returns are not good.
SKEW has returned to normal
During the December 2018 crash, many market watchers noted that SKEW had collapsed. Now that the stock market is rallying, SKEW is rallying as well.
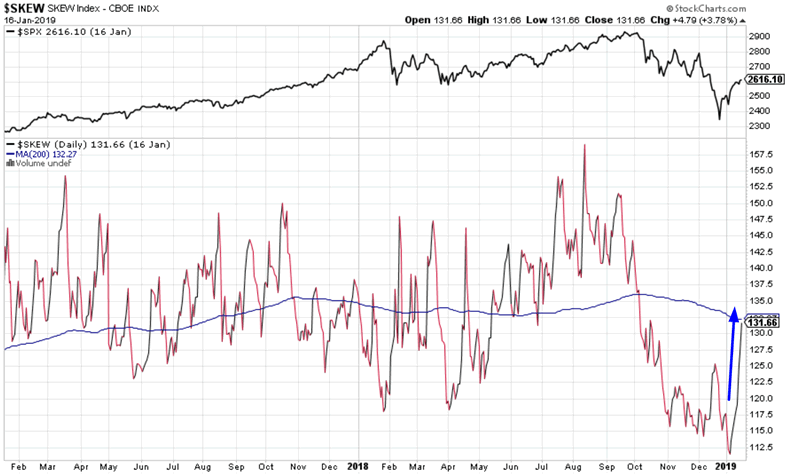
*While most traders see SKEW as the probability of a black-swan event, this indicator seems to mostly move inline with the stock market itself. E.g. as the stock market rises, SKEW becomes high, and as the stock market falls, SKEW falls.
Here’s what happens next to the S&P when SKEW goes from more than -10% below its 200 dma to above its 200 dma within 2 weeks.
*Data from 1990 – present
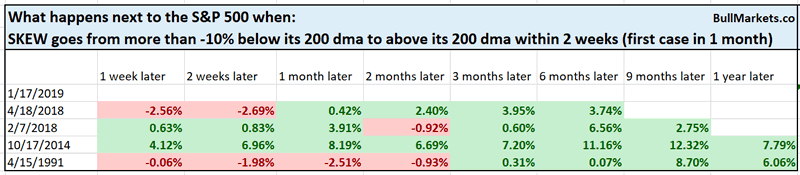
Sample size is small, but at the very least this isn’t a medium term bearish sign for stocks.
Short term leans bearish
The short term is rarely anything more than a 50/50 bet, which is why most short term market studies conflict with eachother.
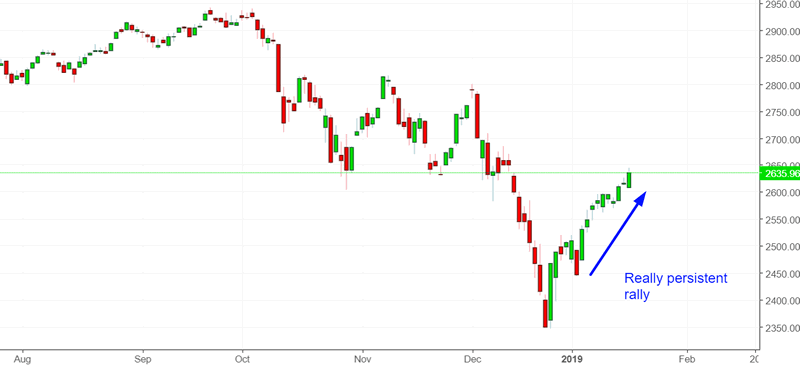
The S&P’s rally has been very persistent over the past 2 weeks.
The S&P has closed higher than the daily OPEN for 10 days in a row.
Here are similar cases, from 1962 – present
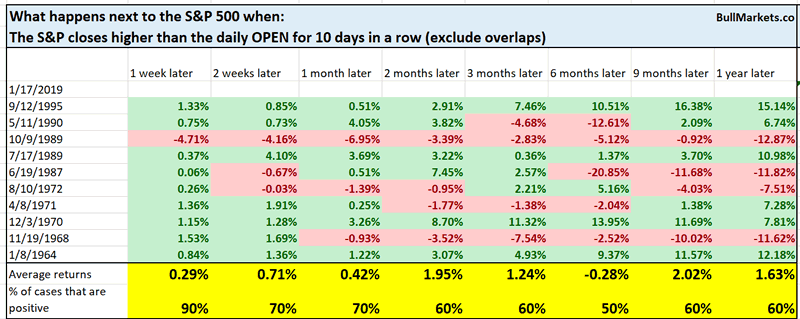
As you can see, the S&P’s 1 week forward returns were consistently bullish. Momentum usually grinds higher. However, ALL of these cases occurred when the S&P was above its 200 dma, while the S&P is below its 200 dma right now. Hence, I wouldn’t see this as a short term bullish sign this time.
AAII
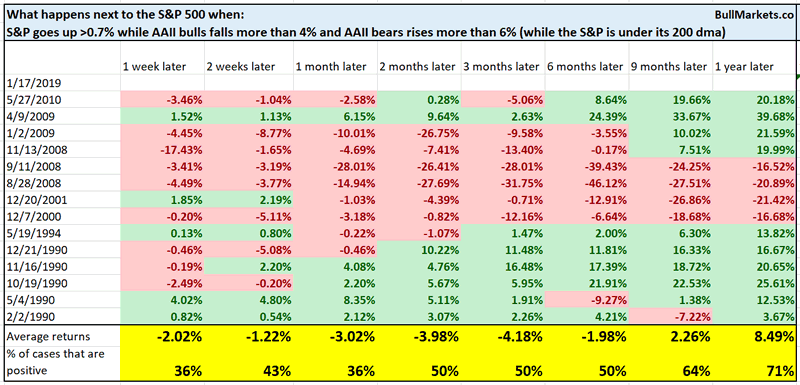
The interesting thing about last week’s AAII report is that while the stock market went up, AAII bulls % fell and AAII bears % went up.
Similar cases in which the S&P was below its 200 dma were short term bearish (i.e. 1 month later). Looks like many investors are indeed looking for a retest/pullback.
Macro Context
Click here for yesterday’s market study
Conclusion
Here is our discretionary market outlook:
- The U.S. stock market’s long term risk:reward is no longer bullish. This doesn’t necessarily mean that the bull market is over. We’re merely talking about long term risk:reward. Long term risk:reward is more important than trying to predict exact tops and bottoms.
- The medium term direction (i.e. next 3-6 months) is neutral. Some market studies are medium term bullish while others are medium term bearish
- The stock market’s short term has a slight bearish lean. Focus on the medium-long term (and especially the long term) because the short term is extremely hard to predict.
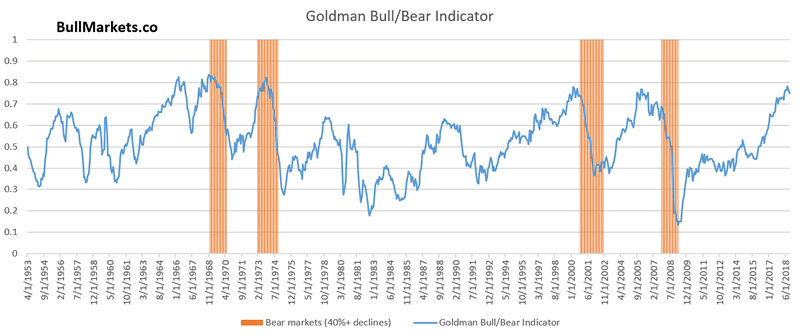
Goldman Sachs’ Bull/Bear Indicator demonstrates that while the bull market’s top isn’t necessarily in, risk:reward does favor long term bears.
Our discretionary outlook is not a reflection of how we’re trading the markets right now. We trade based on our quantitative trading models.
Members can see exactly how we’re trading the U.S. stock market right now based on our trading models.
Click here for more market studies
By Troy Bombardia
I’m Troy Bombardia, the author behind BullMarkets.co. I used to run a hedge fund, but closed it due to a major health scare. I am now enjoying life and simply investing/trading my own account. I focus on long term performance and ignore short term performance.
Copyright 2019 © Troy Bombardia - All Rights Reserved
Disclaimer: The above is a matter of opinion provided for general information purposes only and is not intended as investment advice. Information and analysis above are derived from sources and utilising methods believed to be reliable, but we cannot accept responsibility for any losses you may incur as a result of this analysis. Individuals should consult with their personal financial advisors.
© 2005-2022 http://www.MarketOracle.co.uk - The Market Oracle is a FREE Daily Financial Markets Analysis & Forecasting online publication.