


Is Gold Market 2019 Like 2016?
Commodities / Gold & Silver 2019 Feb 15, 2019 - 12:38 PM GMTBy: Arkadiusz_Sieron

 Have you even wanted to travel in time? You can, at least when reading about the gold market. Many analysts claim that this year is like 2016 for the gold market. We invite you to read our today’s article about the similarities and differences between the precious metals market then and today and find out what do they imply for the gold prices.
Finally, the scientists have invented the time machine! This is at least what we hear from many people: that we went back in time to 2016. Indeed, there are certain similarities between the precious metals market then and today. What are they – and what do they imply for the gold prices?
Let’s look at the chart below, which shows the price of the yellow metal since December 2015. As one can see, gold has rallied since December 2018, just like three years earlier.
Chart 1: Gold prices (London P.M. Fix, in $) from December 2015 to January 2019.
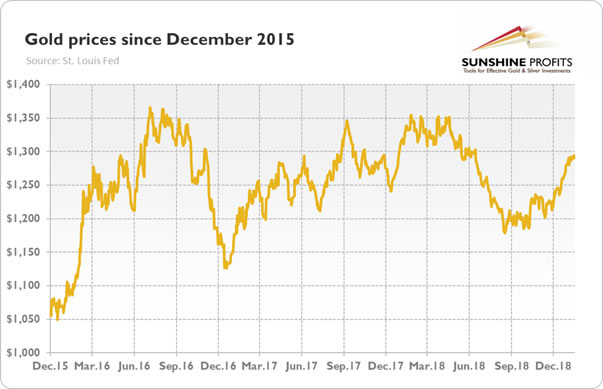
However, the bullion also rallied at the beginning of 2017 and 2018, so why this year would be similar particularly to 2016? The next two charts should provide the answer.
Chart 2: S&P 500 Index from December 2015 to January 2019.
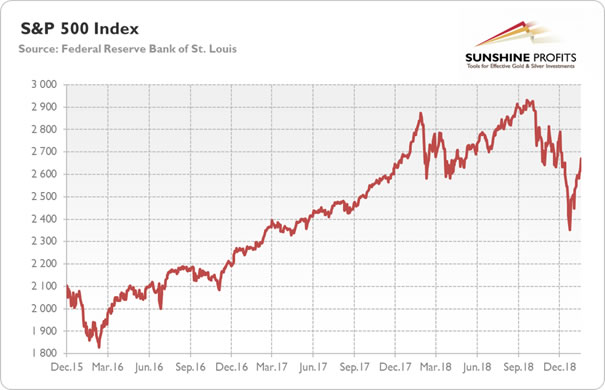
Chart 3: Effective Federal Funds Rate from December 2015 to January 2019.
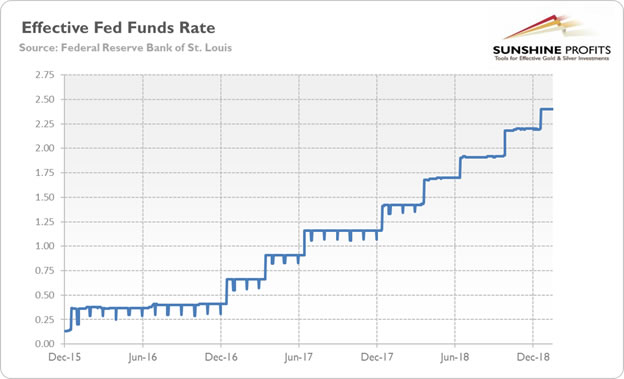
As one can see, at the turn of 2015 and 2016, the global stock markets tumbled. The S&P 500 Index fell about 11 percent from December 2015 to February 2016, amid the poor Chinese economic data and following China’s stock collapse. As a consequence, the Fed paused its tightening cycle after the first hike in December 2015, raising interest rates not earlier than in December 2016. So, it lifted the federal funds rate only once in the whole year, although it forecasted four hikes. Under these conditions, gold soared about 20 percent between December 2015 and March 2016.
The similarities to 2015/2016 should now be obvious. The S&P 500 Index plunged about 16 percent in December 2018 (however, it partially rebounded since then). The Fed hiked interest rates that month, but it sent a clear dovish message, suggesting that it could be patient with further hawkish moves. So far, the price of the yellow metal jumped about 5 percent since December 2018.
We can therefore expect further increases, right? Not so fast. Similarities are great, but investors should not forget about differences. First of all, in 2015, the price of gold started its rally only after the FOMC meeting, in line with the “sell the rumor, buy the fact” strategy. Three years later, gold entered its upward trend already in November. It might suggests that gold may run out of steam earlier this time. In fact, this may have already happened.
Second, in 2016, the stock market plunge took the Fed by surprise, while this time, the Fed fully acknowledged the decline in stock prices by its December meeting – and acted accordingly, calming the financial markets. It’s not good for gold, which thrives when investors are afraid.
Third, in January 2016, the Bank of Japan introduced negative interest rates, amplifying investors’ worries in the marketplace. This time, nothing like that happened. It implies that the risk-on sentiment may return sooner in 2019, hitting the safe-haven assets, such as gold.
Fourth, as Przemysław Radomski, CFA showed in the Gold & Silver Trading Alerts, three years ago,
(…) miners lead the way and they continued to outperform and soar for weeks. The reality now is completely different – we have miners that are clearly underperforming (…) That’s simply a counter-trend, zig-zag-shaped correction – not the beginning of a major new uptrend.
Fifth, in early 2016 gold was after a multi-year decline and now it’s after a few months of price increases and within a few-year long consolidation, close to its upper border. While gold might have been oversold on a medium-term basis in early 2016, it’s definitely not the case right now.
To sum up, making analogies is tempting, as this is how we learn about the world. However, investors should watch out for false analogies, as they could result in losses. True, in 2016, there was a strong rally in precious metals, but it was triggered by the fear trade. Surely, both the stock market volatility and credit spreads also increased at the end of 2018, as the chart below shows.
Chart 8: The CBOE Volatily Index (green line, right axis) and BofA Merrill Lynch US High Yield CCC or Below Option-Adjusted Spread (red line, left axis) from December 2015 to January 2019.
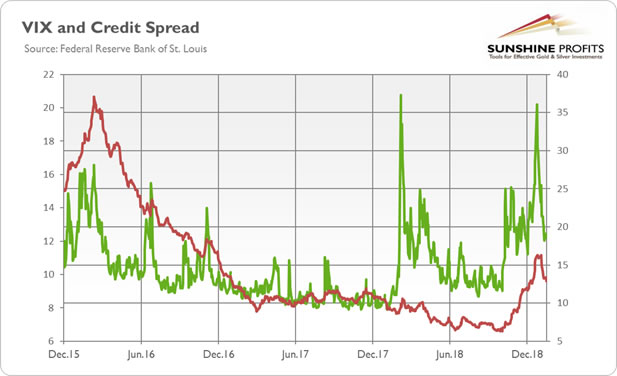
However, as one can see, both the indices actually corrected, suggesting that the biggest fears are actually behind us. And please note that, although the VIX spiked higher, the credit spreads increased much more modestly this time. But what is the most important is that gold can sometimes rise because of fear, but for the long-term bull market to begin, we have to see the sustained decline in the US dollar. Also, spikes in the VIX tend to accompany tops in gold, not bottoms, therefore – as odd as it may sound – when the stocks are after severe volatility jump, it’s time to consider getting out of the gold market, not entering it.
Will we see a fall in the greenback? Well, the American currency seems to be overvalued according to several measures (such as the Big Mac Index). If the Fed pauses, trade wars end, and we see uptick in the Eurozone’s economic growth and yields, then the US dollar should weaken, supporting the yellow metal. The key word here, however, is “if”.
Thank you.
If you enjoyed the above analysis and would you like to know more about the gold ETFs and their impact on gold price, we invite you to read the April Market Overview report. If you're interested in the detailed price analysis and price projections with targets, we invite you to sign up for our Gold & Silver Trading Alerts . If you're not ready to subscribe at this time, we invite you to sign up for our gold newsletter and stay up-to-date with our latest free articles. It's free and you can unsubscribe anytime.
Arkadiusz Sieron
Sunshine Profits‘ Market Overview Editor
Disclaimer
All essays, research and information found above represent analyses and opinions of Przemyslaw Radomski, CFA and Sunshine Profits' associates only. As such, it may prove wrong and be a subject to change without notice. Opinions and analyses were based on data available to authors of respective essays at the time of writing. Although the information provided above is based on careful research and sources that are believed to be accurate, Przemyslaw Radomski, CFA and his associates do not guarantee the accuracy or thoroughness of the data or information reported. The opinions published above are neither an offer nor a recommendation to purchase or sell any securities. Mr. Radomski is not a Registered Securities Advisor. By reading Przemyslaw Radomski's, CFA reports you fully agree that he will not be held responsible or liable for any decisions you make regarding any information provided in these reports. Investing, trading and speculation in any financial markets may involve high risk of loss. Przemyslaw Radomski, CFA, Sunshine Profits' employees and affiliates as well as members of their families may have a short or long position in any securities, including those mentioned in any of the reports or essays, and may make additional purchases and/or sales of those securities without notice.
Arkadiusz Sieron Archive |
© 2005-2022 http://www.MarketOracle.co.uk - The Market Oracle is a FREE Daily Financial Markets Analysis & Forecasting online publication.