


Stock Market Pause Should Extend
Stock-Markets / Stock Markets 2019 Apr 21, 2019 - 02:48 AM GMTBy: Andre_Gratian

 Current Position of the Market
SPX: Long-term trend – Final long-term phase on the way? How much longer is the question.
Intermediate trend – The trend which started at 2346 is ready for another pull-back which should be followed by a final high before a significant correction begins.
Analysis of the short-term trend is done on a daily basis with the help of hourly charts. It is an important adjunct to the analysis of daily and weekly charts which discusses the course of longer market trends.
Daily market analysis of the shor-term trend is reserved for subscribers. If you would like to sign up for a FREE 4-week trial period of daily comments, please let me know at ajg@cybertrails.com
Pause Should Extend
Market Overview
As anticipated, the SPX is pausing after its last advance of 110 points from 2785. The past five days traded in a 27-point range which looked ready to start a decline on Thursday, but the index managed to bounce into the close and prevent further damage. The formation is looking toppy and, with a minor cycle low due in a few days, we should expect a minor correction. However, if it exceeds 2865-70 on the downside, we could turn this into 100+ points decline which could continue into the first few days of next month.
The minor cycle span is not always exact and, if it made its low early on Thursday (unlikely), or is inverting, we could continue the distribution process for a few more days before rolling over. All we have at the daily and hourly level is negative divergence with, as we will see on the chart, only the daily A/Ds having given a sell signal. We need more than that to ensure that a correction is starting.
Chart Analysis (The charts that are shown below are courtesy of QCharts)
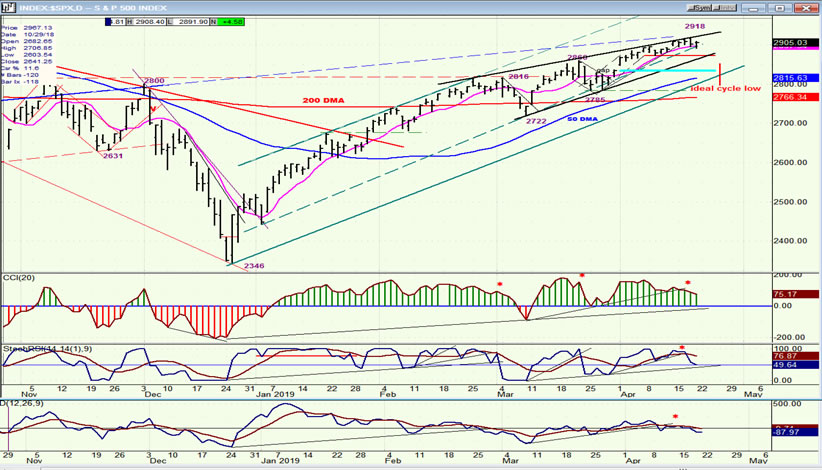
SPX daily chart
SPX has made five or six hits on the top line of the wedge formation, each time being repealed at least 10 points before the next attempt at breaking above it. This has created a congestion pattern which has the potential to cause a correction of about one hundred points if the index drops below 2865 (red horizontal line). If so, it will also go through the bottom line of the wedge pattern, fill the gap which is marked by a light blue line, and come to rest on the larger channel line and 50-dma which, combined, would create strong support likely to end the correction in the first week of May.
The deceleration taking place in the index price is obvious enough on the chart itself, but it is even more obvious in the indicators which have reversed after posting some negative divergence. As of Thursday’s close, only the lower A/Ds indicator had given a sell signal, the middle one is on the verge of doing so, but it will take the top one going negative before we can have more than a shallow pull-back.
A drop to the larger channel line/50-dma would be the ideal place from which to start our final rally inside the channel before it is broken.
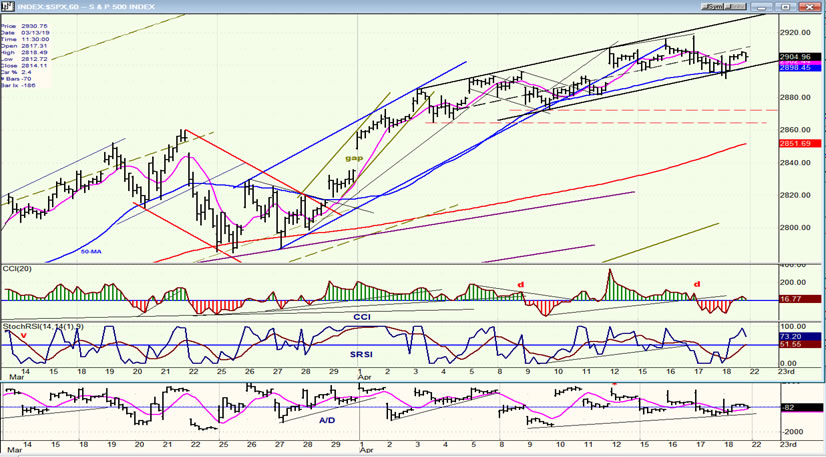
SPX hourly chart
Instead of showing the entire wedge pattern, the hourly chart focuses on the channel that has been created at its top. It is now two weeks long, with the index showing its first sign of weakness on Thursday by breaking below the bottom trend line; but it held and bounced, perhaps because a long weekend was ahead. Another move outside of the channel/50-hr MA should evolve into a downtrend which may find temporary support at 2865. If it keeps going, the distribution pattern above that level has a count which can take it as low as 2820-2800.
Thursday’s bounce prevented the indicators from giving a sell signal. A move below 2890 will create one.
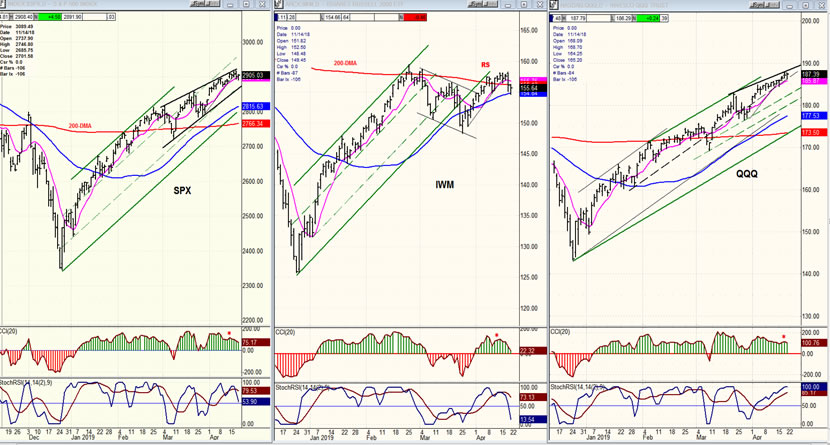
SPX, IWM, NDX (dly)
There has not been a change in the relationship between these three indexes. QQQ continues to be the strongest and IWM the weakest on an intermediate basis. But the latter has seemingly begun to reassert its leadership on the downside -- ‘seemingly’, because it has not yet given a confirmed sell signal. A move below the blue 50-dma will also send the top oscillator into the red, leaving no doubt that another decline has started, with the other two expected to join in.
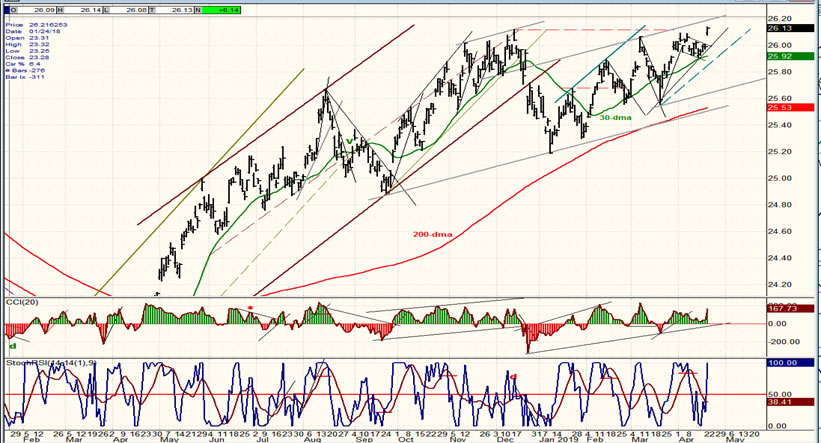
UUP (Dollar ETF) (daily)
UUP made a little consolidation pattern which found support on the 30-dma. It has now extended its move back to the top of the channel, making a slightly new high in the process. The 30-dma will have to be broken before UUP can reverse its uptrend.
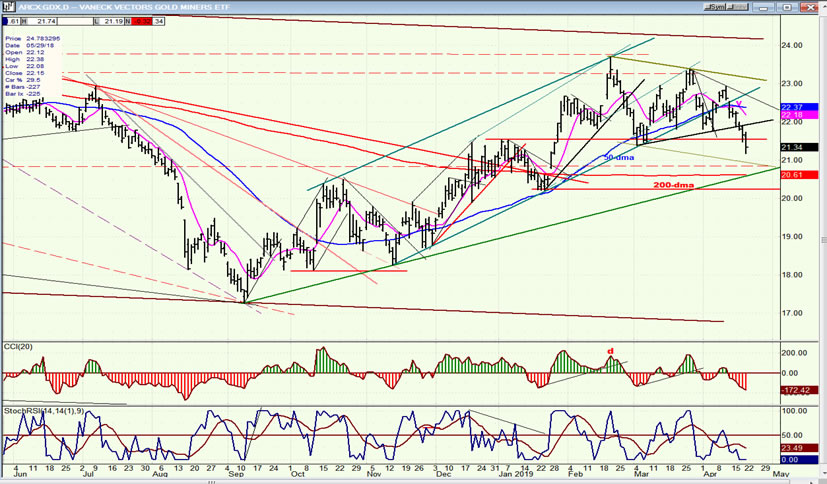
GDX (Gold miners ETF) (daily)
GDX was not making a triangle after all and UUP made sure of that! GDX has made a new correction low and will need more time to get back on its feet. Meanwhile, the correction could easily continue down to the 200-dma or a little lower. This is supported by the P&F chart pattern.
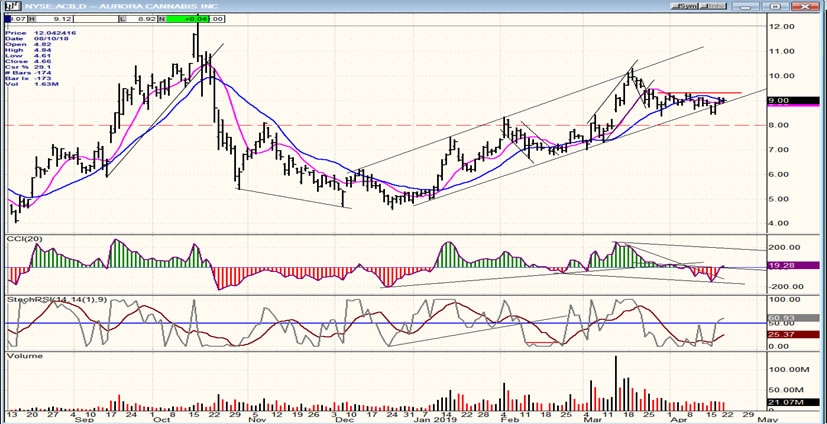
ACB (Aurora Cannabis) (daily)
ACB continues to consolidate, but may be just about ready to move higher. It needs to get above 9.30 on increased volume for a break-out which would most likely take it to a new high of at least 11.
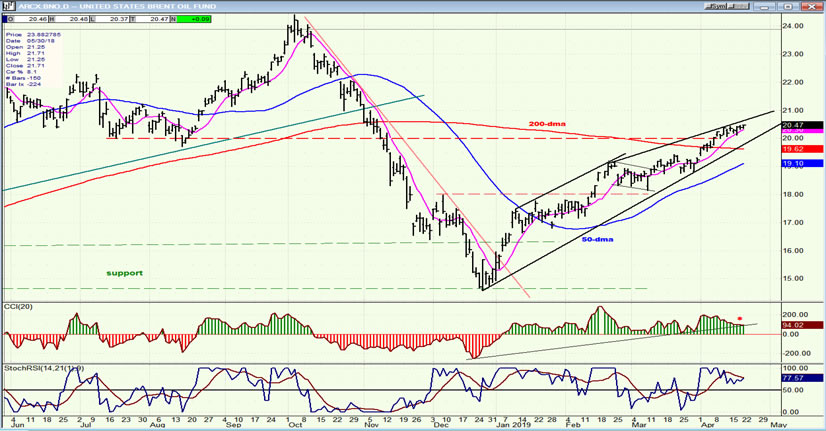
BNO (United States Brent Oil Fund) (daily)
BNO is making the same topping pattern as SPX, which makes it likely to correct along with the market when it does. It has not made any progress in over a week and this has created negative divergence in its oscillators. A close below the 9-dma should result in a sell signal.
Summary
SPX looks increasingly toppy with the odds favoring a decline of perhaps as much as a hundred points before resuming its intermediate uptrend from 2346 to a final high before a more substantial correction.
Andre
For a FREE 4-week trial, send an email to anvi1962@cableone.net, or go to www.marketurningpoints.com and click on "subscribe". There, you will also find subscription options, payment plans, weekly newsletters, and general information. By clicking on "Free Newsletter" you can get a preview of the latest newsletter which is normally posted on Sunday afternoon (unless it happens to be a 3-day weekend, in which case it could be posted on Monday).
Disclaimer - The above comments about the financial markets are based purely on what I consider to be sound technical analysis principles uncompromised by fundamental considerations. They represent my own opinion and are not meant to be construed as trading or investment advice, but are offered as an analytical point of view which might be of interest to those who follow stock market cycles and technical analysis.
Andre Gratian Archive |
© 2005-2022 http://www.MarketOracle.co.uk - The Market Oracle is a FREE Daily Financial Markets Analysis & Forecasting online publication.