


US Stock Market Leading Macro Economic Indicators Update
Economics / US Economy May 12, 2019 - 04:59 PM GMTBy: Troy_Bombardia

 Instead of trying to predict when the economy will deteriorate in the distant future (which countless experts have tried and failed), we simply look for deterioration among the leading indicators. Instead of predicting the next 10 steps, we seek to predict the next 1-2 steps for the economy.
Here’s a brief summary of the leading economic indicators we track
Positive factors
- Labor market
- Corporate profits
- Financial conditions
- Loans
- High yield spreads
- Inflation-adjusted new orders
- Heavy Truck Sales
Negative factors
- Housing
- Yield curve
- Inflation-adjusted retail sales
- Earnings revisions
- Average weekly hours
Conclusion
Overall, macro points to continued economic growth. A recession is unlikely to start within the next few months.
Right now, the most likely start date for a recession is in 2020. If macro remains decent when January 2020 comes around, we will push the most likely start date for a recession even further into the future. Be flexible as the data changes.
Why macro matters
The economy drives corporate earnings, which drives the stock market in the long term. As a result, bull markets usually coincide with economic expansions, and big bear markets usually coincide with recessions.
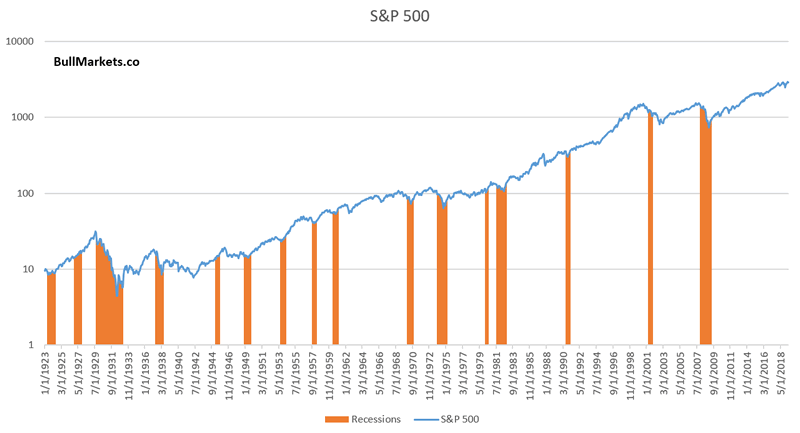
Since the stock market tends to peak before recessions begin, we need to look at leading economic indicators which also deteriorate before recessions begin.
This doesn’t mean that the stock market’s exact top cannot occur before macro starts to peak. This happened in January 1973, when the stock market peaked a few months before macro started to deteriorate. However, the biggest part of bear markets always occur after macro has deteriorated significantly.
Positives
Labor market
Labor market indicators do not show any significant deterioration right now.
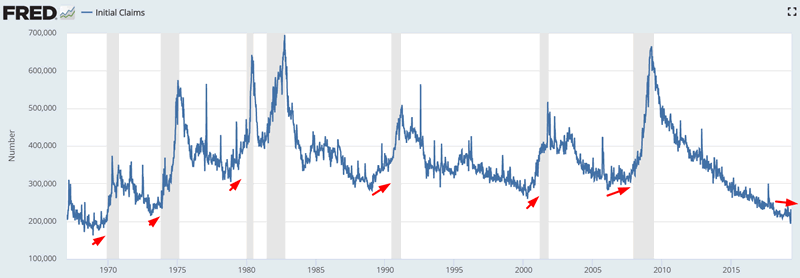
Initial Claims
Initial Jobless Claims measures the number of jobless claims filed by people who are seeking to receive jobless benefits. In other words, this measures the number of people who are recently unemployed.
The latest reading for Initial Claims fell from 230k to 228k. More importantly, Initial Claims has been mostly trending sideways over the past 9 months.
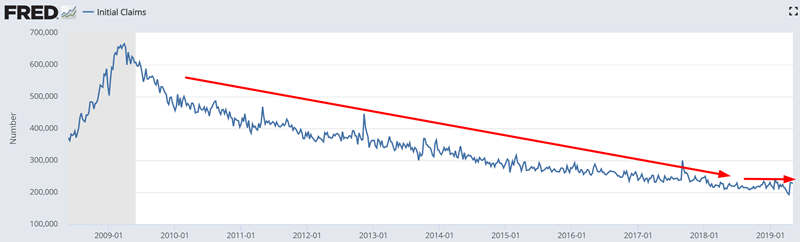
In the past, Initial Claims trended higher before a recession began. This is still a positive point for macro, but watch out over the next few months in case Initial Claims trends upwards because Initial Claims is very low right now.
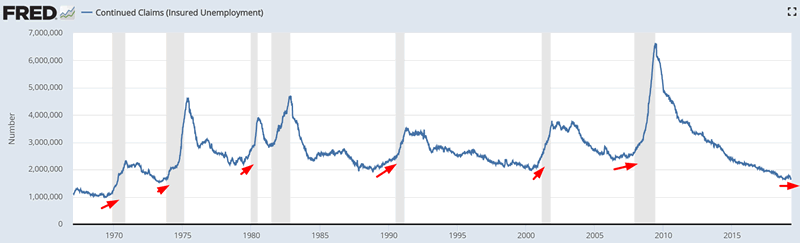
Continued Claims
Continued Jobless Claims measures the number of people who are still filing jobless claims (past the initial claim). In other words, this measures the number of people who remain recently unemployed.
The latest reading for Continued Claims increased from 1.671 million to 1.684 million. More importantly, Continued Claims has been mostly trending sideways over the past 9 months.
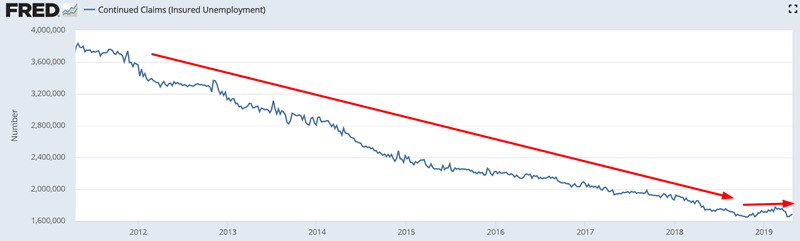
In the past, Continued Claims trended higher before a recession began. This is still a positive point for macro, but watch out over the next few months in case Continued Claims trends upwards because Continued Claims is very low right now.
Unemployment Rate
The Unemployment Rate’s latest reading made a new low for this economic expansion (3.6%).
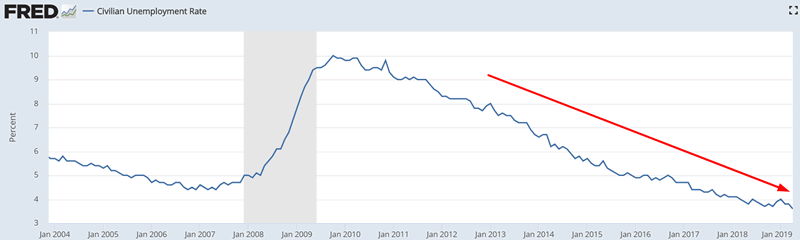
This is a positive point for macro because in the past, Unemployment trended sideways or upwards before a recession began.
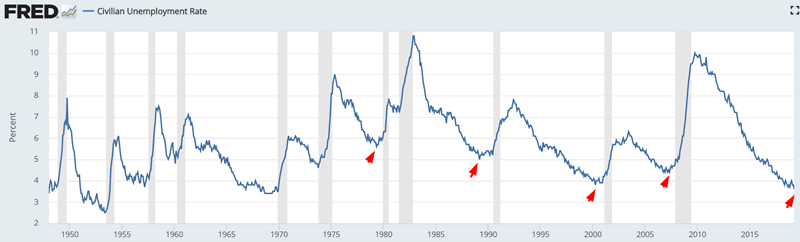
*The Unemployment Rate lags Initial Claims and Continued Claims a little.
KC Fed Labor Market Conditions Index, Momentum Indicator
The KC Fed Labor Market Conditions Index’s latest reading fell from 1.08 to 1.01. More importantly, this index is still above zero.
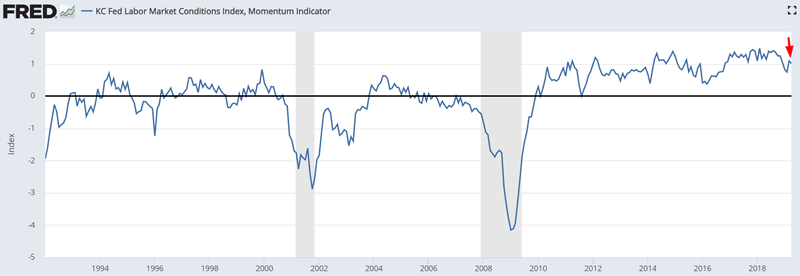
According to FRED: “A positive value indicates that labor market conditions are above their long-run average, while a negative value signifies that labor market conditions are below their long-run average.” 0 is a necessary but not sufficient requirement for recessions.
The KC Fed Labor Market Conditions Index remains above zero, which means that this “necessary but not sufficient” requirement for recessions has not been fulfilled.
Corporate Profits
Figures related to corporate profits suggest that while the economic expansion is late cycle, a recession is not imminent.
Unit Profits
Unit Profit’s latest reading fell from 99.86 to 99.73. More importantly, Unit Profits has been trending sideways for years.
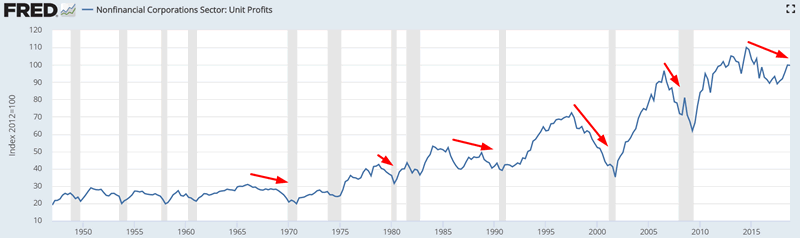
This is a late-cycle sign for the economic expansion. In the past, Unit Profits usually peaked mid-expansion. While this suggests that the economic expansion is late-cycle, this indicator is not a timing tool. Unit Profits can fall for years before a recession begins.
Corporate Profits
Inflation adjusted corporate profits’ latest reading fell from 8.24 to 8.21. More importantly, inflation-adjusted corporate profits is still trending higher.
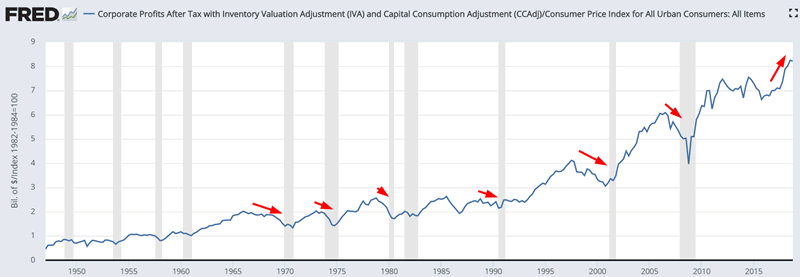
In the past, inflation-adjusted corporate profits trended downwards for several quarters before recessions began.
Financial conditions
Indicators related to financial conditions remain relatively loose. This is positive for macro.
Chicago Fed Financial Conditions Credit Subindex
The Chicago Fed Financial Conditions Credit Subindex remains very low at -0.71. More importantly, the Credit Subindex is trending sideways right now.
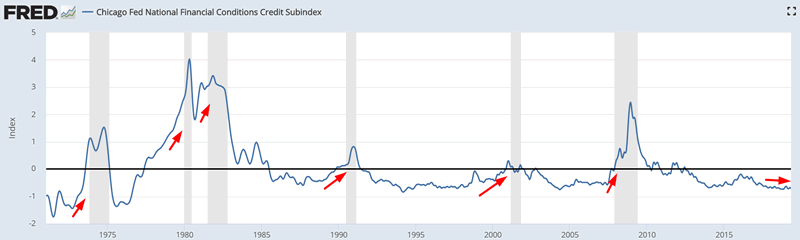
In a credit-driven economy, the Credit Subindex tends to trend upwards (i.e. tighten) before a recession begins.
Banks’ lending standards
The latest reading for Net Percentage of Banks Tightening Standards fell from 2.8% to -4.2%. More importantly, banks’ lending standards has not trended upwards.
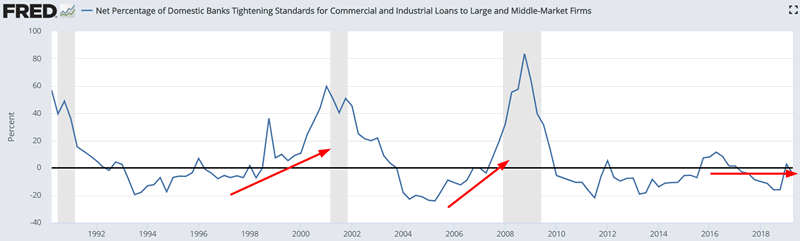
In the past, lending standards tightened for several quarters before a recession began. This is a positive for macro right now.
Loans
The Delinquency Rate on All Loans fell from 1.59% to 1.53%. More importantly, the Delinquency Rate is trending downwards.
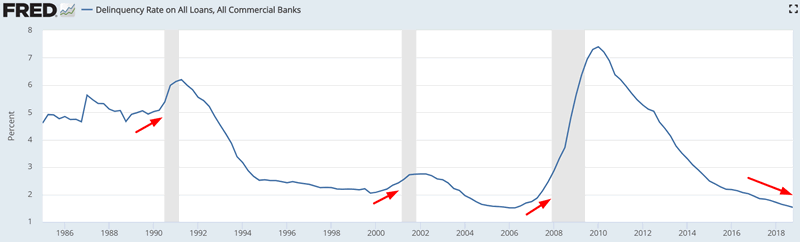
In the past, the Delinquency Rate trended higher before a recession began. This is a positive for macro.
High yield spreads
High yield spreads are narrowing right now (i.e. trending downwards).
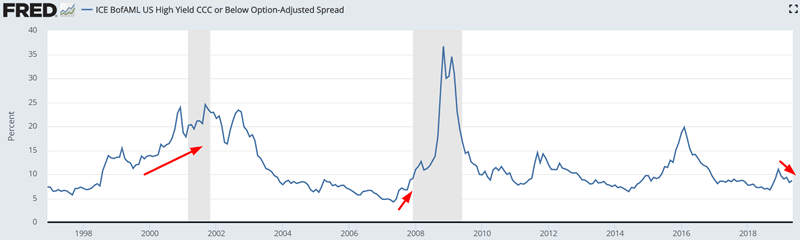
In the past, high yield spreads tend to widen (trend higher) before recessions began. This is because the average bond market participant is usually more aware of risk than the average stock market participant.
Inflation-adjusted new orders
The latest reading for inflation-adjusted new orders increased from 174.09 to 175.79. More importantly, inflation-adjusted new orders is trending up.
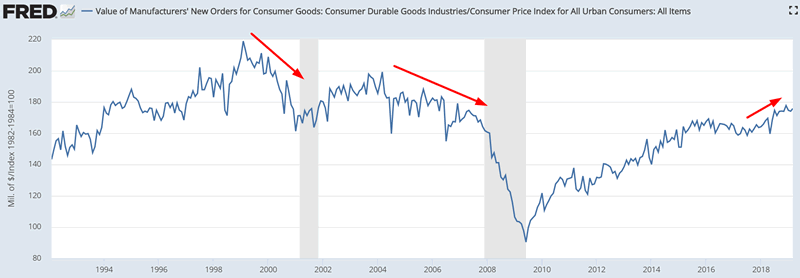
In the past, inflation-adjusted new orders trended downwards before recessions began (this indicator is a component in the Conference Board’s LEI). This is a positive for macro right now.
Heavy Truck Sales
The latest figure for Heavy Truck Sales fell from 0.516 million to 0.508 million. More importantly, Heavy Truck Sales is trending sideways.
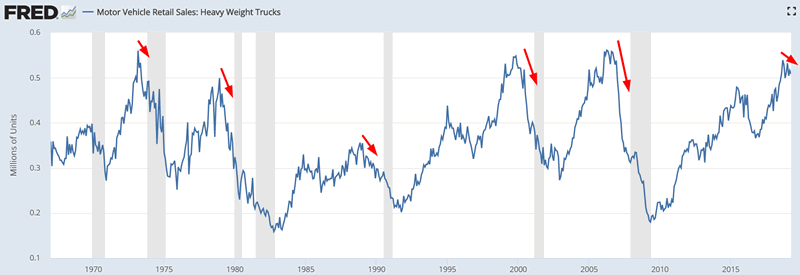
In the past, Heavy Truck Sales trended downwards before recessions began. This is a slight positive for macro right now, but watch out in case Heavy Truck Sales starts to fall over the next few months.
Negatives
Housing
The housing market – a key leading segment of the U.S. economy, shows some signs of mild deterioration.
Housing Starts
The latest reading for Housing Starts fell from 1142k to 1139k. More importantly, Housing Starts is trending sideways/downwards.
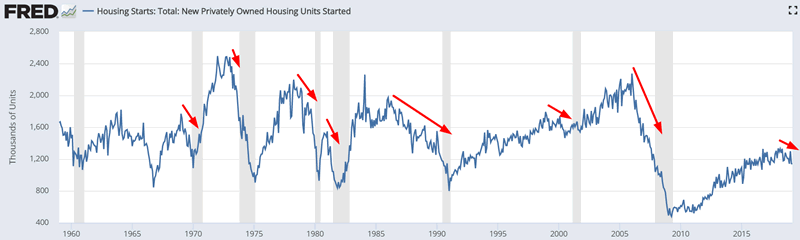
In the past, Housing Starts trended downwards before recessions began. This is a negative for macro.
Building Permits
The latest reading for Building Permits fell from 1.291 million to 1.281 million. More importantly, Building Permits is trending downwards.
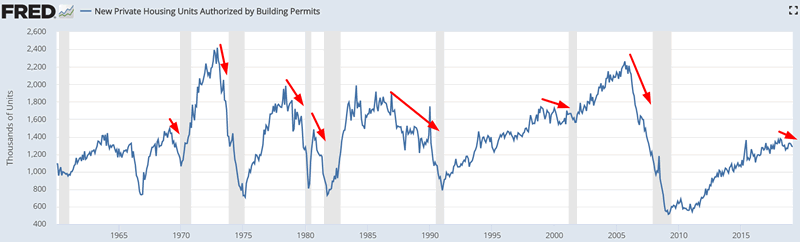
In the past, Building Permits trended downwards before recessions began. This is a negative for macro.
New Home Sales
The latest reading for New Home Sales increased from 662k to 692k. More importantly, New Home Sales is trending sideways.
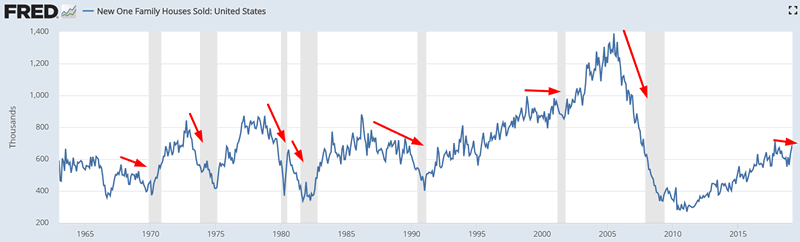
In the past, New Home Sales trended downwards before recessions began. This is neutral for macro.
NAHB Housing Market Index
The latest reading for the NAHB Housing Market Index increased from 62 to 63. More importantly, the NAHB Housing Market Index is trending downwards.
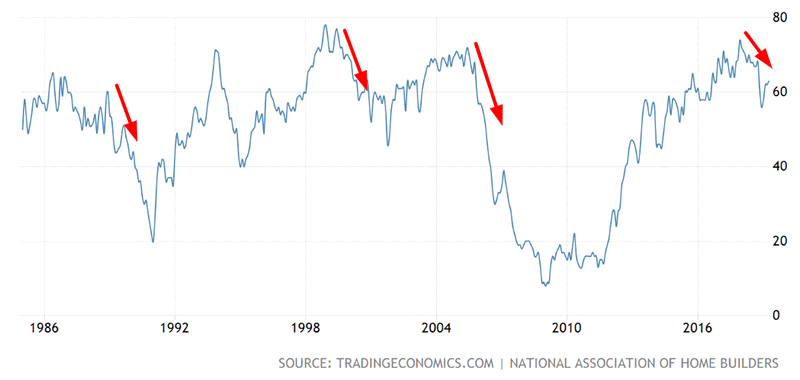
In the past, the NAHB Housing Market Index trended downwards before recessions began. This is a negative for macro.
Monthly Supply of Houses
The latest reading for Monthly Supply of Houses fell from 6.3 to 6. More importantly, this indicator is trending sideways.
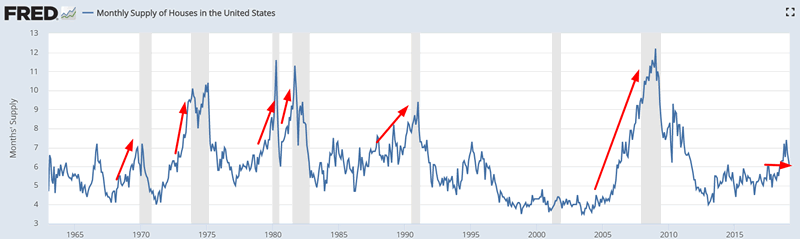
The Monthly Supply of Houses looks at the ratio of houses for sale vs. houses sold. In other words, it’s a measure of inventory in the housing market and how hard it is for sellers to sell. The higher this ratio, the tighter the housing market becomes.
In the past, the Monthly Supply of Houses usually (but not always) trended upwards before recessions began. This is neutral for macro right now.
Yield curve
Various sections of the yield curve have either inverted or are close to inverting.
Here is the popular 10 year – 3 month yield curve, which has already inverted.
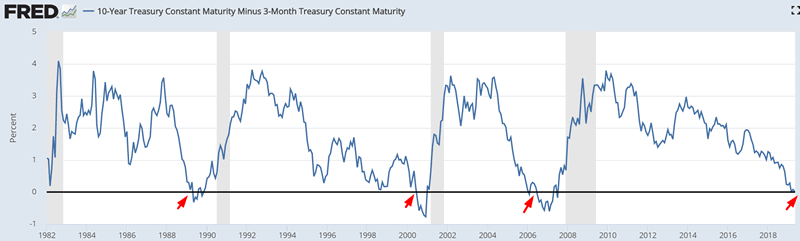
The 10 year – 3 month yield curve tends to invert 1-1.5 years before a recession begins. The more accurate recession signal occurs when the 10 year – 3 month yield curve steepens after inverting (Fed cuts short term rates as the economy falls into a recession). This has not happened yet.
Here is the 10 year -2 year yield curve, which currently stands at 0.19% (close to inverting).
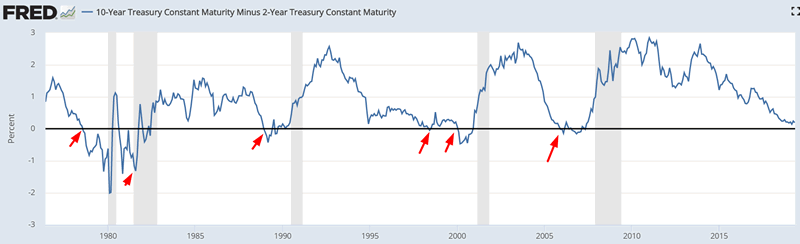
Like the 10 year – 3 month yield curve, the 10 year – 2 year yield curve tends to invert 1-1.5 years before a recession begins. This has not happened yet.
Overall, the inverting yield curve is a slight negative for macro right now. While this is extremely hyped up in the media and financial media, the yield curve is merely one of many macro points to consider.
Inflation-adjusted retail sales

The latest reading for inflation-adjusted Retail Sales increased from 1.999 to 2.022. More importantly, inflation-adjusted Retail Sales has started to trend sideways.
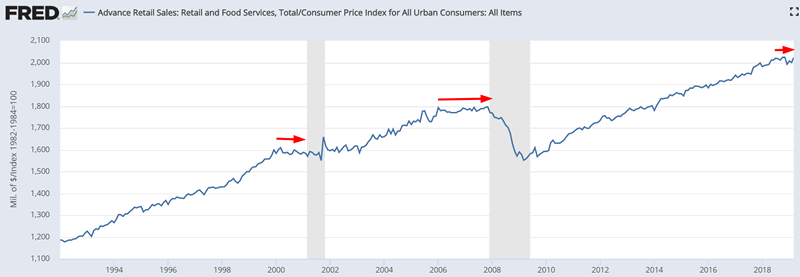
In the past, inflation-adjusted Retail Sales trended sideways before recessions began. This is a slight negative for macro.
Earnings revisions (not the same thing as actual earnings)
U.S. Net Earnings Revisions remain solidly negative.
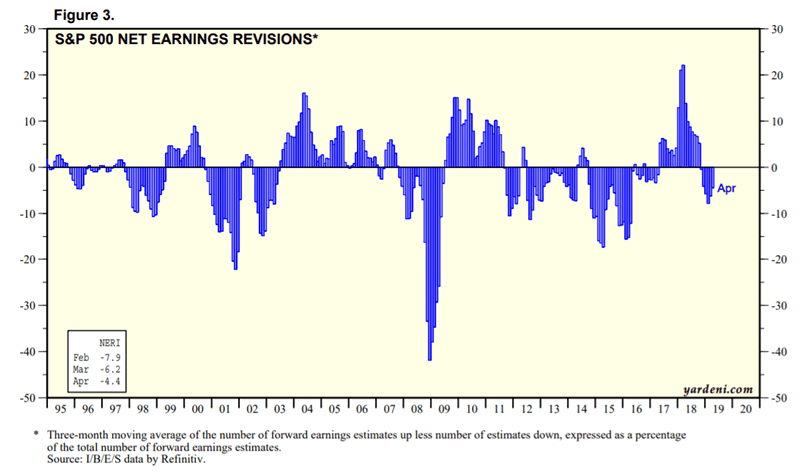
Net Earnings Revisions demonstrates how many companies are increasing their forward earnings estimates minus how many companies are decreasing their forward earnings estimates. In the past, Net Earnings Revisions was negative when recessions started.
This is a necessary but not sufficient condition for recessions, because clearly there are plenty of false signals (see 2011-2016).
Average Weekly Hours of Production and Nonsupervisory Employees: Manufacturing
The year-over-year % change in average weekly hours fell from -1.18% to -1.65%. More importantly, this figure is negative right now.
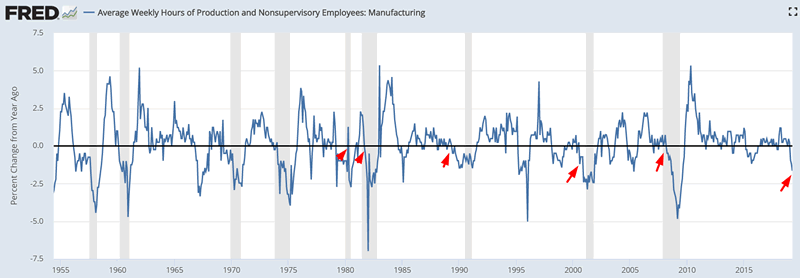
In the past, this figure was usually in negative territory when recessions began. This is a slight negative factor for macro right now.
This is a necessary but not sufficient condition for recessions, because clearly there are plenty of false signals.
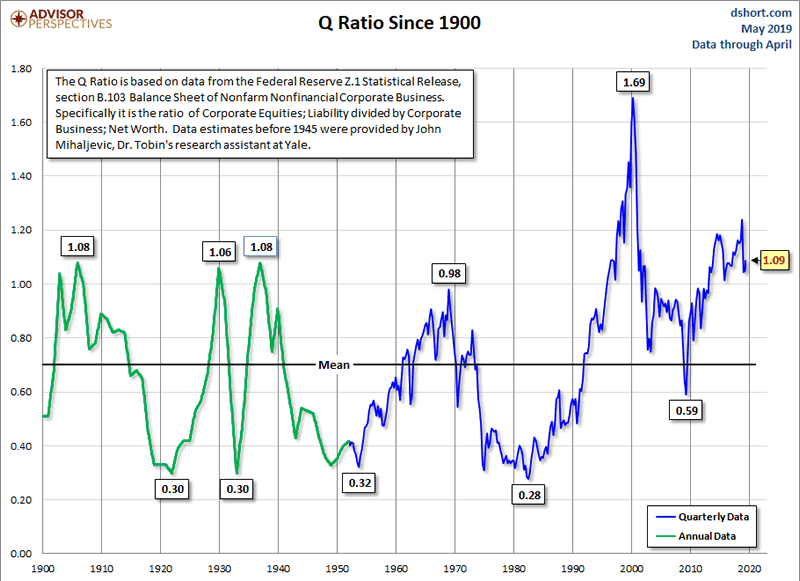
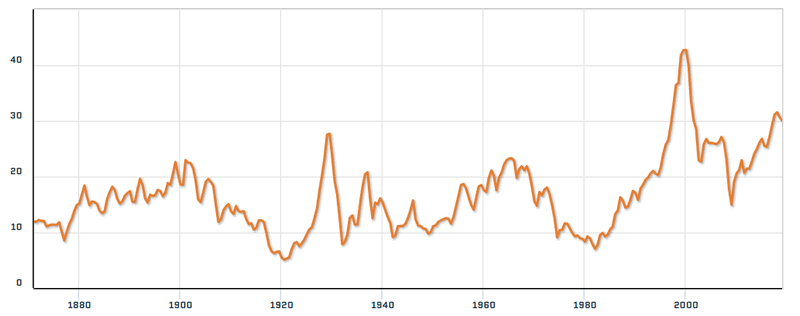
Valuations
And lastly, a quick word on valuations. The U.S. stock market’s valuations are extremely high right now, as they’ve been for most of this decade. You know it, I know it, everyone knows it.
Here’s the popular Tobin’s Q ratio
Here’s the popular Shiller P/E ratio
However, valuations on their own don’t cause bear markets. Recessions do. Valuations are like the powder, and recessions are like the spark. Higher valuations = more dry powder, which means that when the next recession does hit, the explosion will be bigger.
- High valuations + recessions = big bear market
- Low valuations + recessions = big correction.
So while the bears say “valuations are high, stocks will crash!”, that is merely stating the obvious. Valuations are meant for predicting 10 year forward returns. “Eventually” stocks will always crash. But valuations have very little impact on where the stock market will go over the next month, 6 months, 1 year, 2 years, etc. For example, “valuations are high = poor 10 year forward returns” might mean that the S&P goes up 5 years and then falls 5 years.
In other words, valuations don’t matter a lot for market timing unless you are a buy and hold investor. And most people who follow finance on the media, social media, or this website are not buy and hold investors.
Don’t end up like Robert Shiller. Shiller bases most of his market and economic outlook on “extremely high valuations”.
*While I have great respect for Robert Shiller and his work, you can see how valuations lead to poor market predictions. This is just a textbook example of what happens when one treats valuations as a holy grail.
From 2018:
From 2017
From 2015
From 2014
From 2013

From 2011
Click here for more market analysis
By Troy Bombardia
I’m Troy Bombardia, the author behind BullMarkets.co. I used to run a hedge fund, but closed it due to a major health scare. I am now enjoying life and simply investing/trading my own account. I focus on long term performance and ignore short term performance.
Copyright 2019 © Troy Bombardia - All Rights Reserved
Disclaimer: The above is a matter of opinion provided for general information purposes only and is not intended as investment advice. Information and analysis above are derived from sources and utilising methods believed to be reliable, but we cannot accept responsibility for any losses you may incur as a result of this analysis. Individuals should consult with their personal financial advisors.
© 2005-2022 http://www.MarketOracle.co.uk - The Market Oracle is a FREE Daily Financial Markets Analysis & Forecasting online publication.