


Stock Market Anticipated Correction Starts On Cue!
Stock-Markets / Stock Markets 2019 May 13, 2019 - 01:55 PM GMTBy: Andre_Gratian

Current Position of the Market
SPX: Long-term trend – Final long-term phase on the way? How much longer, is the question.
Intermediate trend – The anticipated intermediate term correction has started. Can’t tell yet, if it’s a C-wave or something less.
Analysis of the short-term trend is done on a daily basis with the help of hourly charts. It is an important adjunct to the analysis of daily and weekly charts which discusses the course of longer market trends.
Daily market analysis of the short-term trend is reserved for subscribers. If you would like to sign up for a FREE 4-week trial period of daily comments, please let me know at ajg@cybertrails.com
Anticipated Correction Starts Right On Cue!
Market Overview
Chart Analysis (The charts that are shown below are courtesy of QCharts)
Two weeks ago, I passed on a warning from Erik Hadik (Insiide Track) that he saw the same cluster of cycles that brought about a rapid and significant market decline coming into play again and forming the same ominous peaking pattern. In last week’s letter, I reminded readers of this warning and urged them to take it seriously! Although not conclusive, there were enough technical signs that this was a real possibility. Starting last Monday, that prophecy was fulfilled with a decline of 122 points in the SPX. Although Friday saw a rally which ranged sixty-five points from morning low to late session high, it was not enough to take it out of the downtrend channel, and it was certainly not enough to reverse the trend and give a buy signal.
We’ve heard enough times that bear market rallies are swift and powerful. Friday’s rebound meets those qualifications, especially since it was probably helped greatly by a comment from the president and the treasury secretary that trade talks had gone well. On Friday morning, the SPX did reach a short-term downside target and was due to have a bounce, but it turned out to be more than that, leaving no doubt positive comments about the negotiations had something to do with it. Left to its own resources, the market will have to prove that the bulls have already regained control. That’s unlikely for a number of technical reasons, primarily that the daily indicators are nowhere near ready to give a buy signal. Also, the kind of a top envisaged by the cyclic formation which is behind the selling is not expected to be resolved in a single week.
Although market moves have a cyclical origin, these are usually activated by a news catalyst. In September, the catalyst was a potential trade war, primarily with China. The catalyst activating the current cycle cluster is the unresolved trade war with China. It remains to be seen if it will produce the same results.
SPX daily chart
I’ll keep the analysis so simple that even a technical neophyte can grasp it fully:
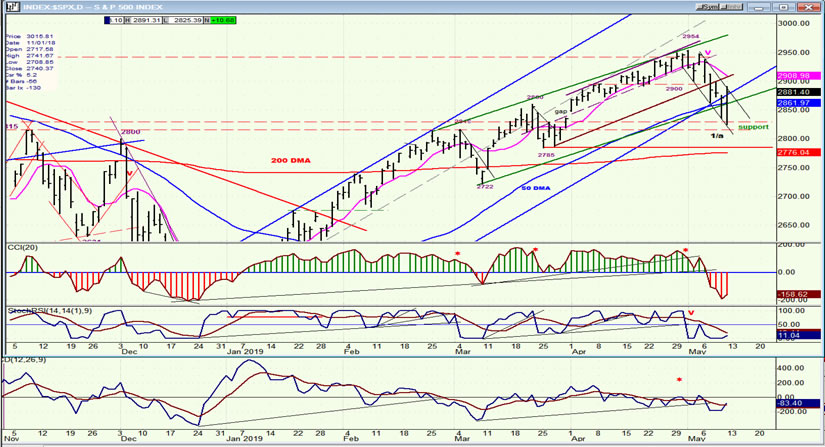
Trend: The trend is broken down into three channels: one long-term (blue) and two short-term (purple and green). These channels are (were) all pointing up and, as long as prices remained within them, the trend was up. The two short-term channels (which are really only one) started to form in March. Their rate of ascent showed that the blue trend was decelerating and, as we got closer to the lower blue line, the onus was on the short-term channels to keep the uptrend going. When prices started to move out of the shorter channel on the downside, they tried briefly to hold on the blue line, but last Thursday they finally broke through it. After doing so, they quickly met with support (dashed red lines), found buyers, and rallied. The rally stopped on the blue trend line which has now become resistance.
The decline has initially taken the form of a small, steep channel. If we have started a longer term decline (which is suggested by the fact that prices have gone outside of the blue channel), the index must resume its downtrend from here. This may come right away, or after a little hesitation around Friday’s close. If we do resume the decline, the next support level is clearly defined. It’s the heavy red line drawn at about 2780. If that level is broken, it will be proof that we have started an intermediate-term decline which will go much lower. That level is also the level of the 200-dma.
Projection: The Point & Figure chart suggested that 2820-25 could be reached on this move. The decline stopped at 2825.39! The upside projection suggests that the rally may have run its course, with the possibility of reaching 2890-2910. There is a larger downside projection which suggests that the decline could continue down to at least 2700.
Indicators: The oscillators first gave a warning that a correction was about to take place, and then confirmed it. Friday’s rally had little impact on their position, and there is not even the most remote sign that they can support a new uptrend.
Conclusion: Over the near-term, the bias is for a short-term topping formation which could form at the level which has already been reached, or slightly higher. Over the intermediate term, the decline is likely to continue. This conclusion will be re-evaluated next week.
SPX hourly chart
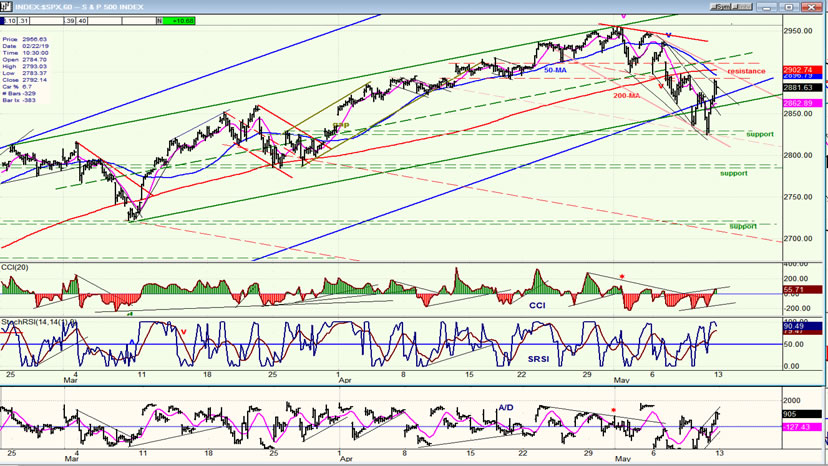
In order to simplify even more, I have eliminated the smallest, purple channel, and kept only the green and blue ones. It makes sense that the first decline found support where it did. It’s the area where the two lower channel lines meet. This is also a test of whether prices can still be contained within both channels. The first test was only partly successful. The index went outside, but rebounded inside both. This tells us that there was not quite enough selling pressure to send the trend decisively outside of both, especially since the decline had started at the top of the green channel. The fact that it did go outside is a sign of weakness, but it also suggests that the bears will probably have to recharge their batteries before making their next attack. This should translate into a sideways move which should build a re-distribution pattern before the decline resumes. For that attack to be successful, the index will have to make a new low, finding its next support either at about 2780 or 2725. We can verify the next target with the P&F count once the re-distribution pattern is complete and prices have again started to fall.
QQQ, SPX, DJIA, IWM (weekly)
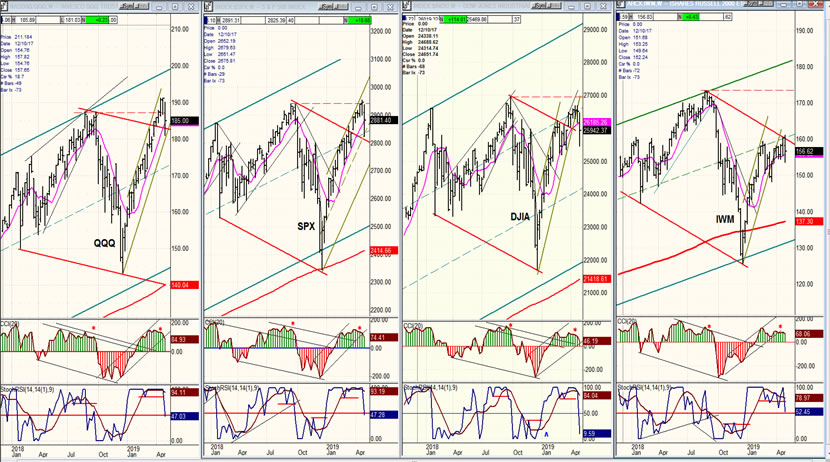
No change in the order of relative strength again this week. The IWM’s relative weakness again proved to give advance warning that we were approaching a correction. If this works as well at the low as at the other extreme, we should have no problem identifying the end of the correction.
The green lines represent the long-term channel lines from 2009. None of the indexes made it to the top channel line before reversing, but we are a long way from being able to say that the long-term trend (bull market) has ended. We have not even yet conclusively broken outside of the intermediate channel of the QQQ and SPX. (Incidentally, note how different the SPX channel is on the weekly chart than on the daily chart. It is much wider!)
UUP (Dollar ETF) daily
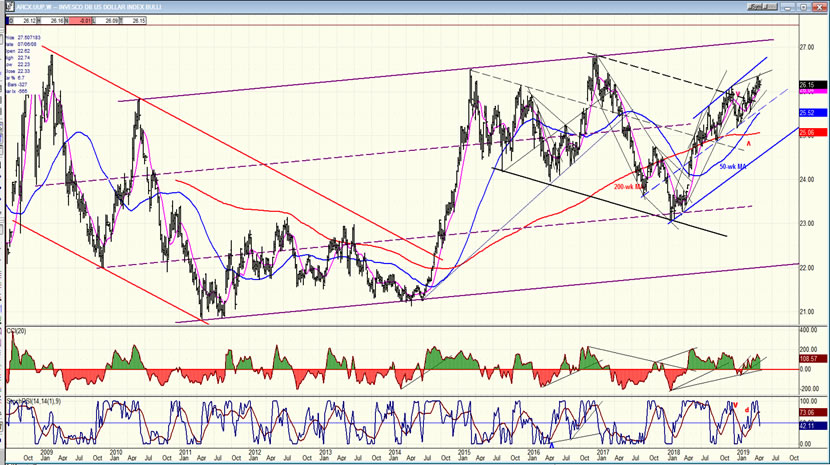
This is a 10-yr chart of UUP. After a 2-year decline and a 3-year base, it had a sharp rise to the top of a long-term channel and is still trading in its upper third. Following a correction within that channel, it has risen back toward the top where it appears to be consolidating. There is no sign of long-term weakness, nor of intermediate weakness; but it could start to pull back toward the 50-wk MA as it consolidates.
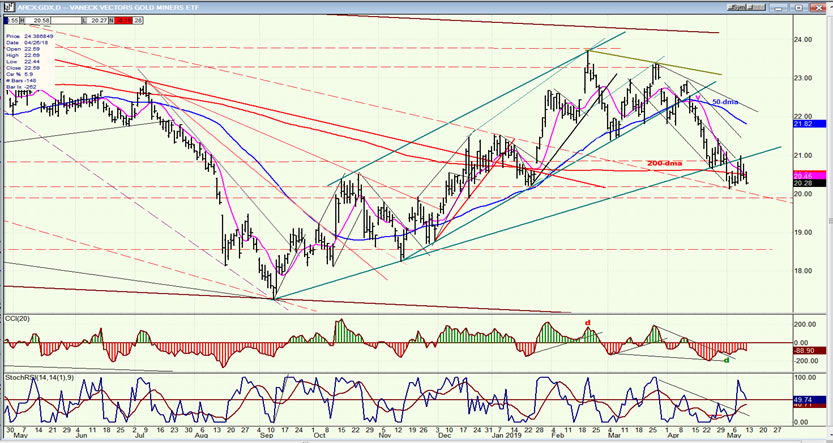
GDX (Gold miners ETF) daily
GDX has pulled back below an uptrend line from its recent low of 17.5, but there has been no follow-through; suggesting that it may be making a short-term base from which it will attempt to get back above the trend line. There is a bias on the upside until the end of the month as UUP continues to correct.
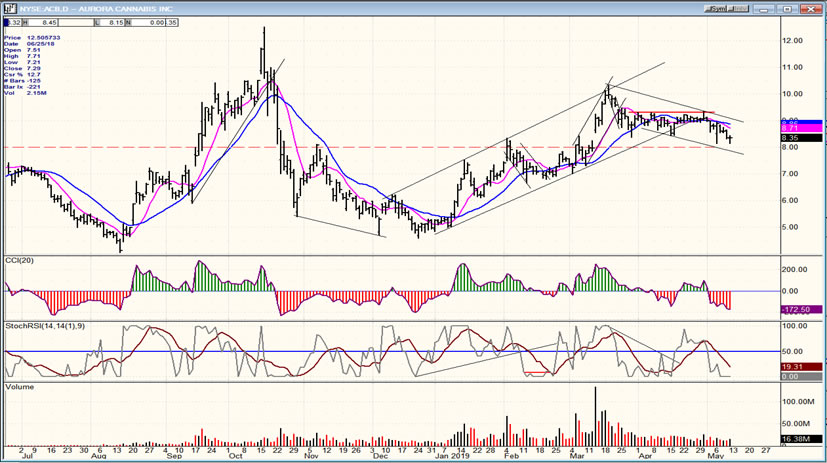
ACB (Aurora Cannabis) daily
ACB may have to weather the decline in the stock market before it can continue its uptrend, although positive developments are expected before long which can move the stock higher in spite of market weakness.
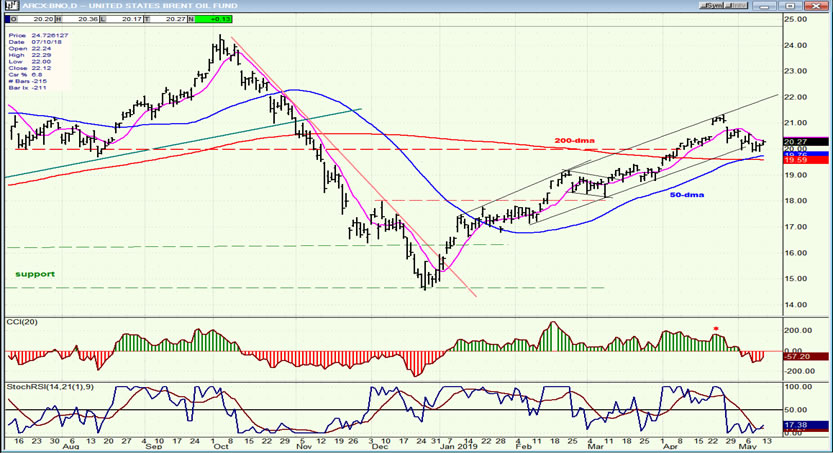
BNO (U.S. Brent oil fund) daily
BNO has pulled back to just above its 50 and 200 dmas which could serve as temporary support.
Summary
The cycle-induced correction which was anticipated has started -- be it a little early-- which means that additional distribution could form over the short term before the downtrend can resume.
Andre
For a FREE 4-week trial, send an email to anvi1962@cableone.net, or go to www.marketurningpoints.com and click on "subscribe". There, you will also find subscription options, payment plans, weekly newsletters, and general information. By clicking on "Free Newsletter" you can get a preview of the latest newsletter which is normally posted on Sunday afternoon (unless it happens to be a 3-day weekend, in which case it could be posted on Monday).
Disclaimer - The above comments about the financial markets are based purely on what I consider to be sound technical analysis principles uncompromised by fundamental considerations. They represent my own opinion and are not meant to be construed as trading or investment advice, but are offered as an analytical point of view which might be of interest to those who follow stock market cycles and technical analysis.
Andre Gratian Archive |
© 2005-2022 http://www.MarketOracle.co.uk - The Market Oracle is a FREE Daily Financial Markets Analysis & Forecasting online publication.