


How Can Stock Market Go Up When We’re Headed Towards a Recession?
Stock-Markets / Stock Markets 2019 Jun 10, 2019 - 06:30 PM GMTBy: Troy_Bombardia

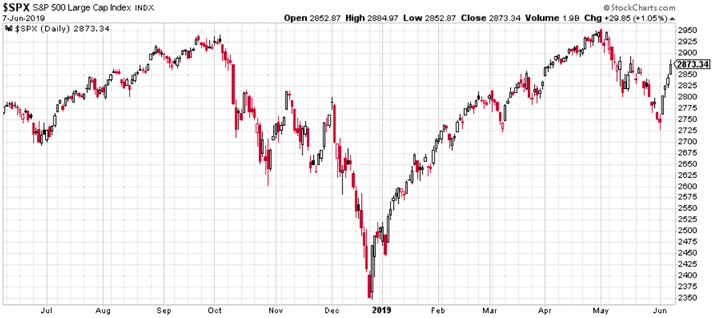
 The common assumption is that bonds are screaming RECESSION right now, while the stock market refuses to hear it. This isn’t entirely true. While the stock market’s long term risk:reward is certainly not bullish, the economic data suggests that a U.S. recession is not imminent.
Various technical factors also suggest that the medium term is still bullish.
And lastly, the biggest short term risk is still trade war news. If this week demonstrated anything, it is that you cannot trade by guessing the news. Focus on the data & facts.
- Long term risk:reward doesn’t favor bulls
- Technicals (medium term): mostly bullish
- U.S. macro: no significant deterioration, although there are pockets of weakness.
Long Term Risk:reward
The stock market’s long term risk:reward favors bears.
Valuations
Everyone knows that valuations are high. Here’s the Shiller P/E ratio, a popular valuation indicator.
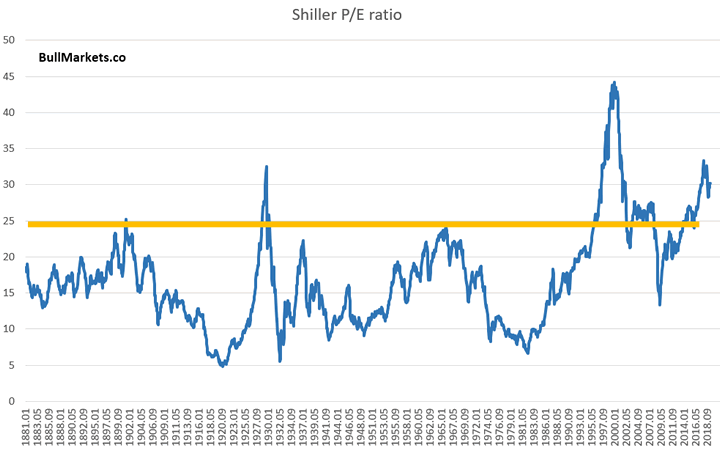
But while valuations give you a sense of how well the stock market will perform over the next 10 years, it tells you very little about what the stock market will do next month, next year, or even the next 2 years.
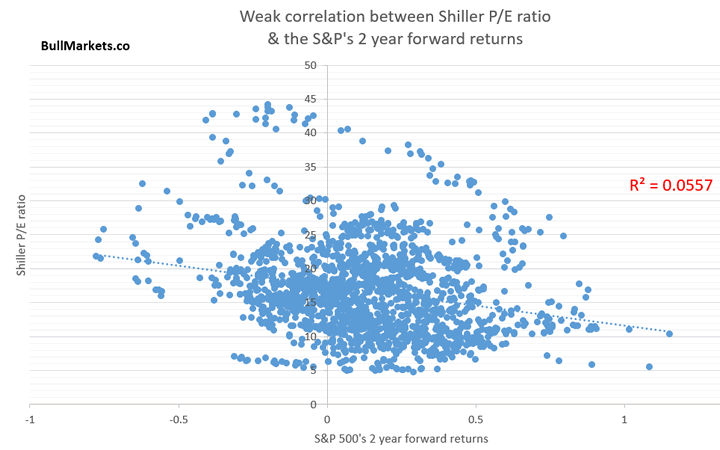
All valuations can tell us right now is that the stock market’s returns over the next 10 years won’t be as good as the past 10 years.
Yield curve
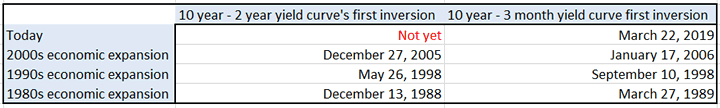
A lot of attention has been paid to the yield curve recently. But what’s surprising is that while the 10 year – 3 month yield curve has inverted, the 10 year – 2 year yield curve has not.
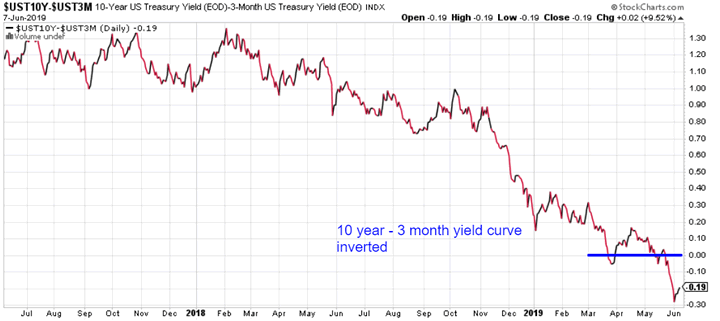
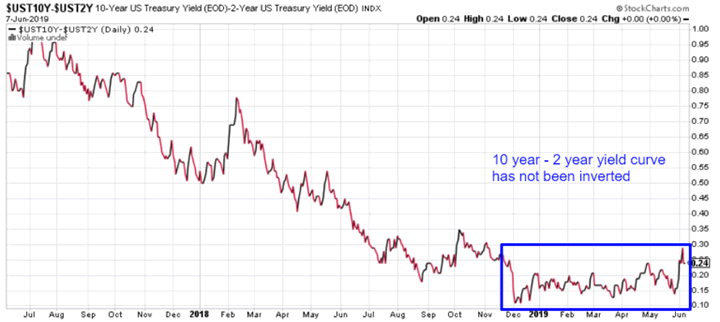
This is abnormal, because the 10 year – 2 year yield curve tends to invert BEFORE the 10 year – 3 month yield curve.
Here’s every single date on which the 10 year – 3 month yield curve was below -0.2%, but the 10 year – 2 year yield curve wasn’t inverted (plotted onto a S&P chart).
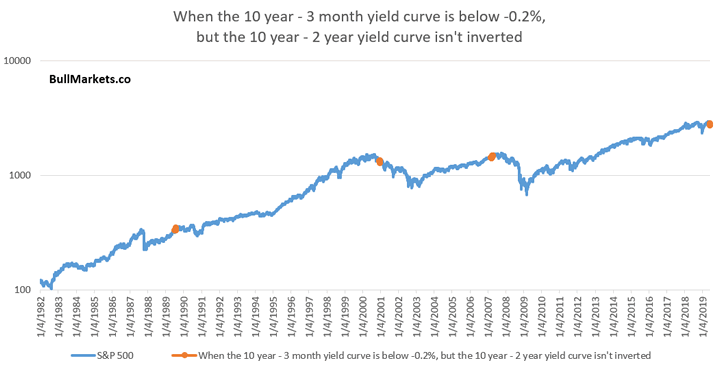
The signal dates come in 3 clusters:
- July 20, 1989 – August 8, 1989
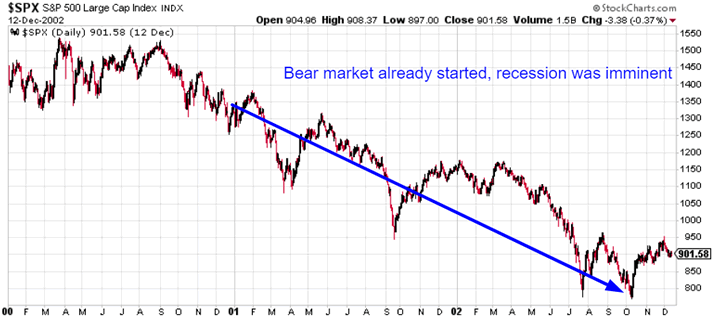
- December 27, 2000 – January 9, 2001
- March 21, 2007 – May 1, 2007
- Now (May 31, 2019 – June 7, 2019)
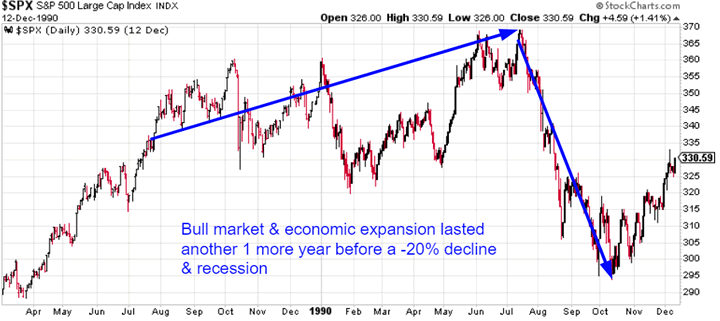
Let’s look at the individual cases. Here’s 1989:
Here’s 2000:
Here’s 2007:
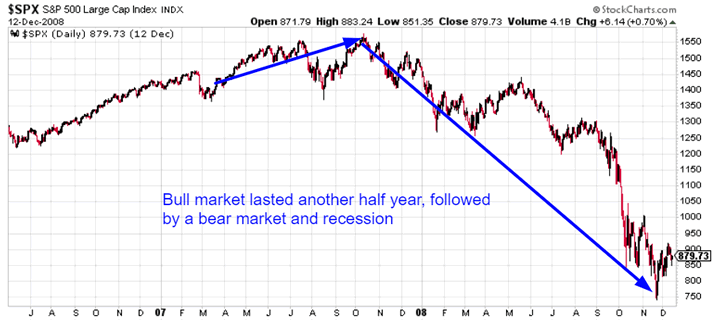
Conclusion: this tends to occur when a recession and bear market has already started, or within 1 year of one. Long term risk:reward favors bears right. With that being said, there is no reason why the stock market cannot go up another 6-9 months.
Technicals: Medium Term
*For reference, here’s the random probability of the U.S. stock market going up on any given day, week, or month.

Although the bull market is certainly late-cycle, the stock market’s medium term (next 6-9 months) leans bullish.
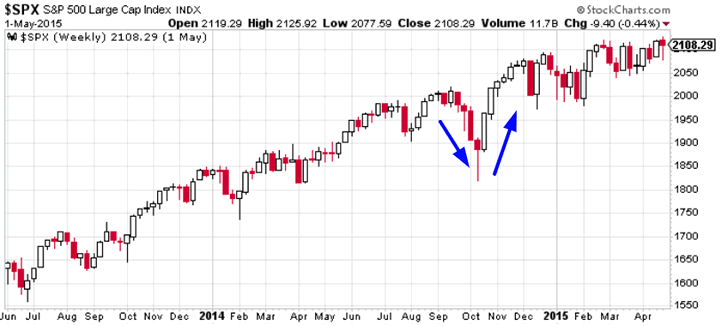
Strong Reversal
The S&P fell 4 weeks in a row and then surged more than 4% this week.
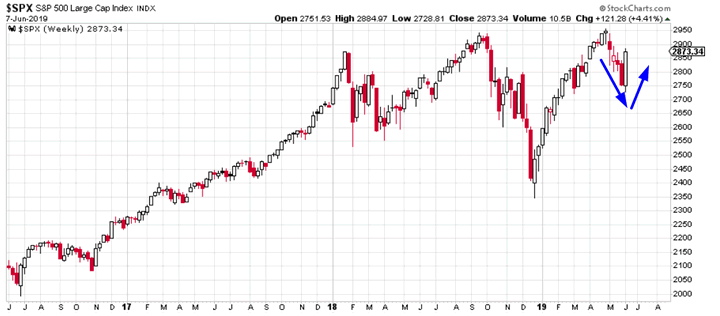
Similar historical patterns could lead to a consolidation over the next few weeks, but this was mostly bullish 3-6 months later.
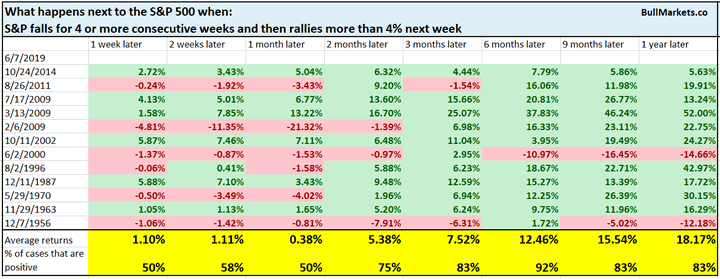
Let’s examine similar historical cases in which this pattern occurred while the S&P was within -5% of a one year high.
October 24, 2014:
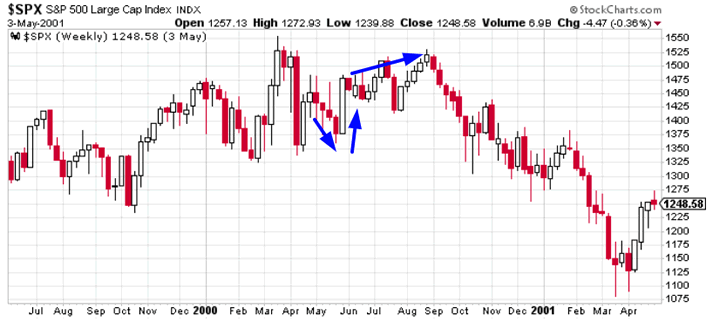
July 2, 2000:
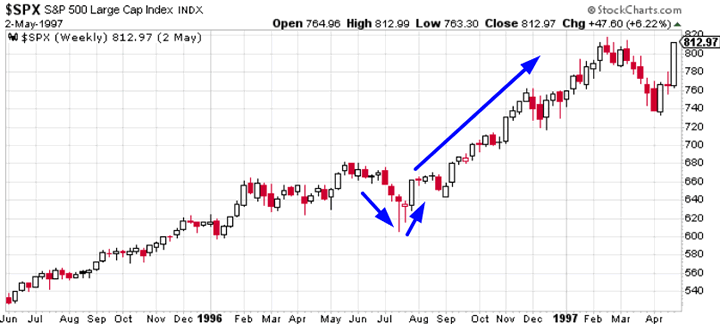
August 2, 1996:
November 29, 1963:
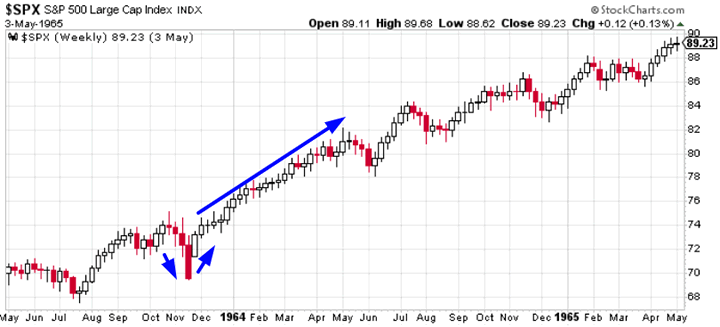
Each of these cases saw more gains over the next 3 months.
Low Treasury yields
Treasury yields continue to decline. Treasury yields and the S&P have been highly correlated recently. The 10 year yield’s 14 weekly RSI is now below 25.
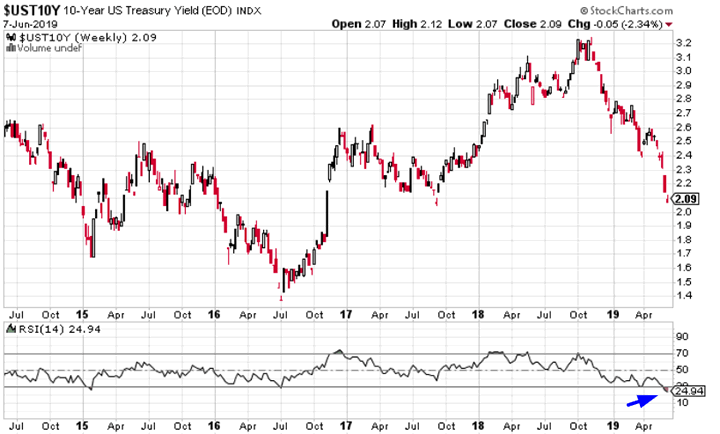
Here’s what happens next to the S&P when the 10 year yield’s 14 weekly RSI falls below 25
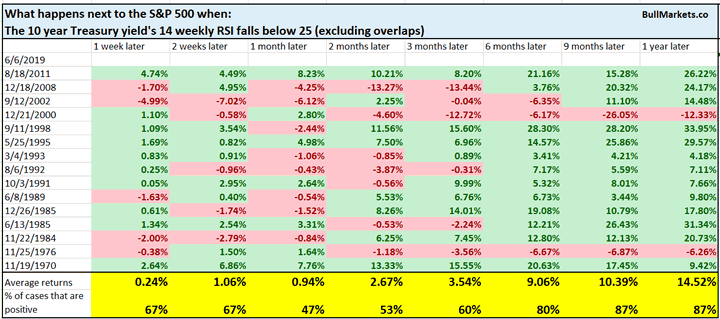
While the 1 month forward returns are slightly bearish, the 6- 12 month forward returns are more bullish.
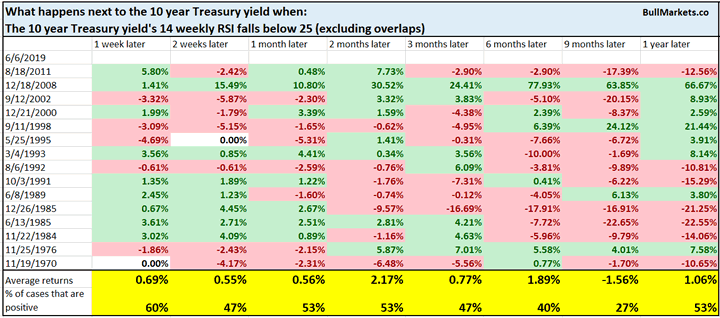
Here’s what happens next to the 10 year yield
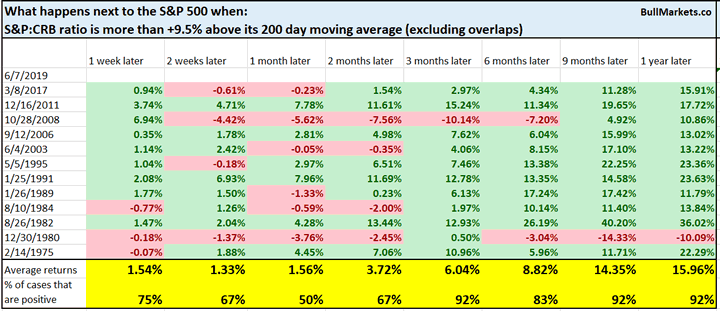
Stocks vs. commodities
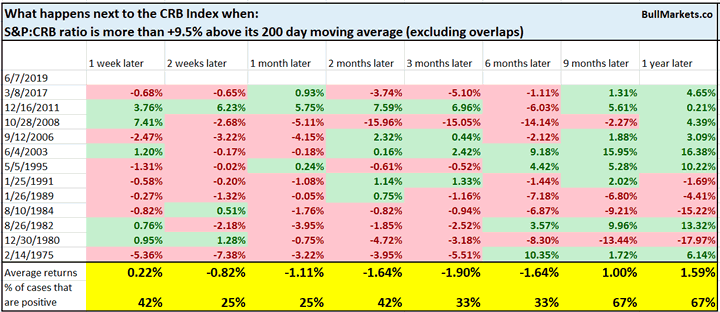
Stocks have significantly outperformed commodities recently, thereby pushing the S&P:CRB ratio more than 9.5% above its 200 day moving average.
*The CRB Index measures a basket of commodities.
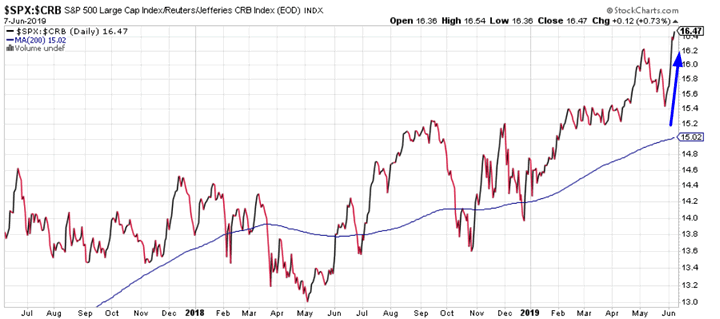
While traders often assume this means that stocks will soon underperform and commodities will soon outperform, that isn’t usually the case.
Here’s what happens next to the S&P
Here’s what happens next to the CRB index
Sentiment
Sentiment continues to fall. Here’s AAII Bulls %.
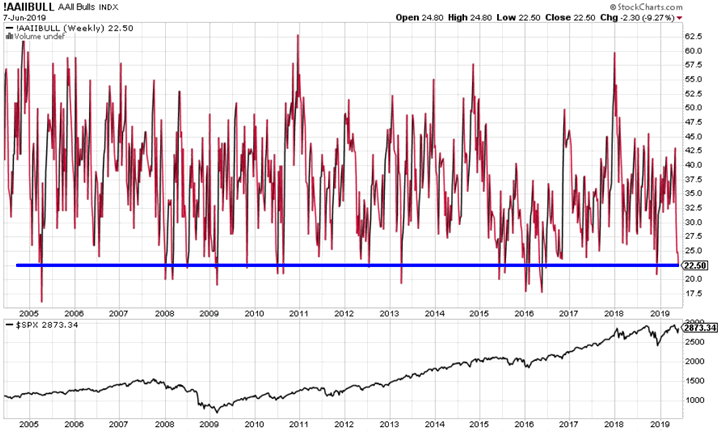
Here’s what happens next to the S&P when AAII Bulls % falls below 23%, while the S&P is within 5% of a 1 year high.
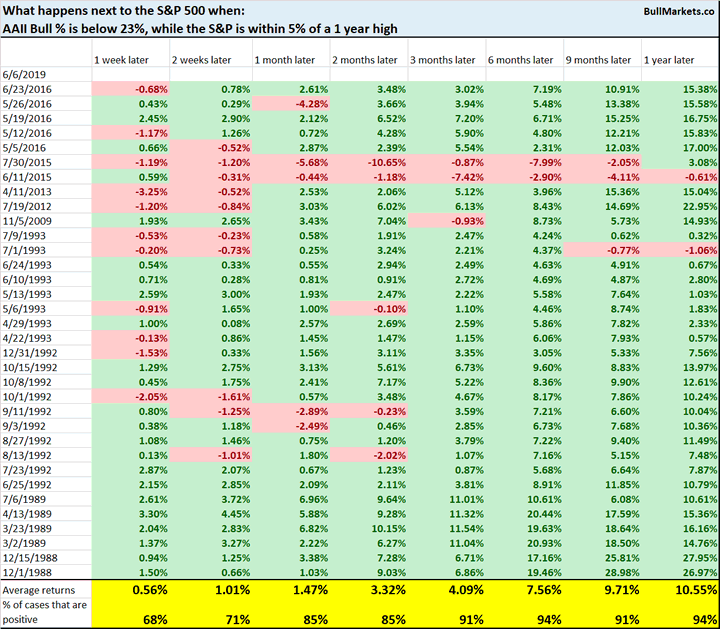
Sentiment remains supportive for stocks 3-12 months later.
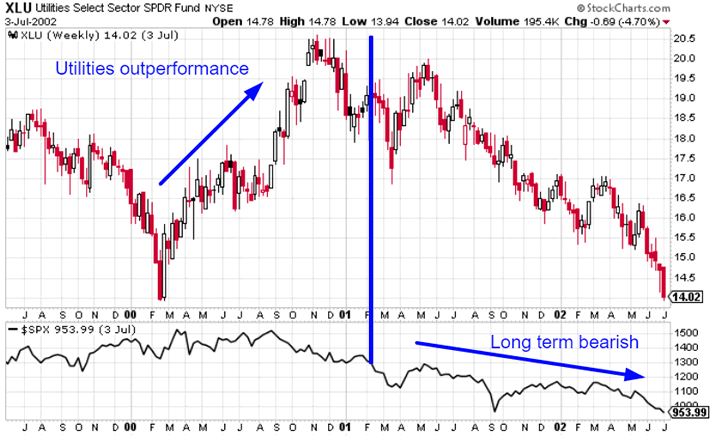
Defensives outperformance
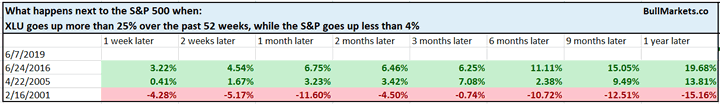
Defensive sectors such as utilities have outperformed over the past year. The utilities ETF XLU is up more than 25% over the past year while the S&P is up less than 4%.
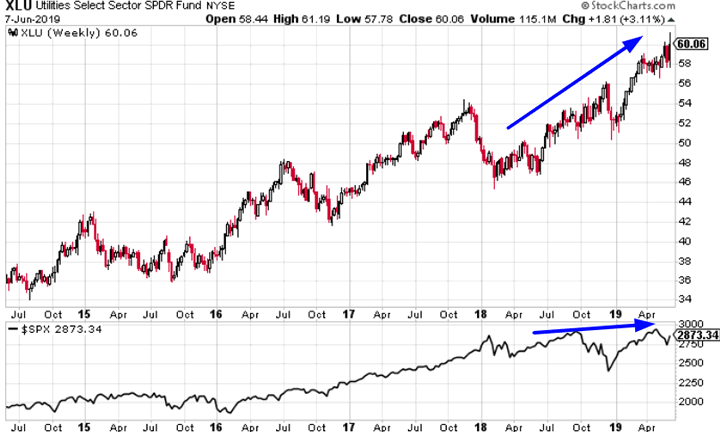
It’s common to see this as a bearish sign for stocks, because utilities (defensive sectors) outperformed during the 2000-2002 bear market. However, there have been 3 cases in which utilities outperformed by this much, and not all of them were bearish.
Here’s June 2016:
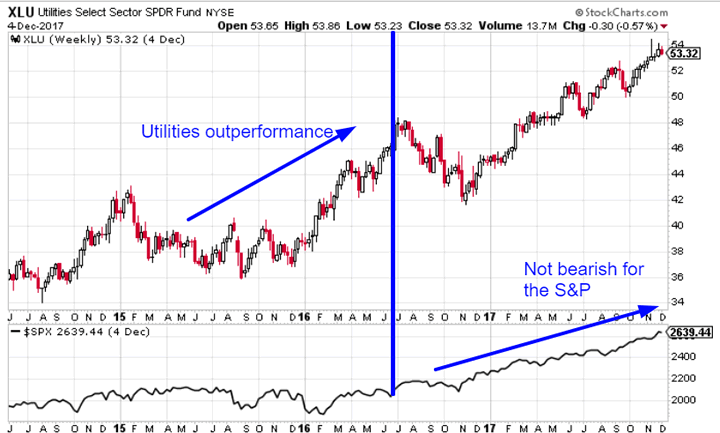
Here’s April 2005:
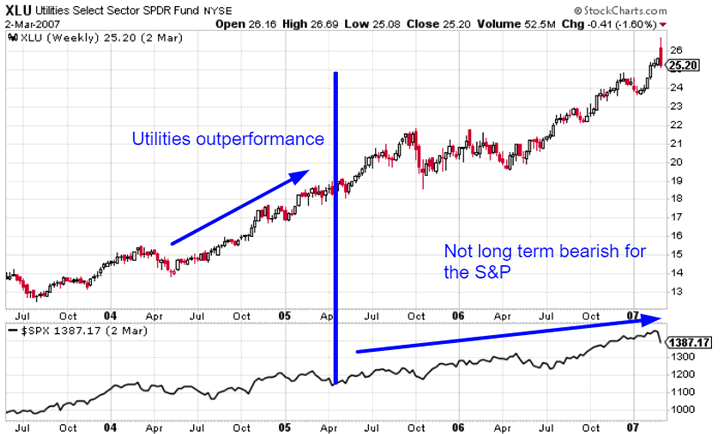
Here’s February 2001:
Fundamentals: Long Term
The stock market and the economy move in the same direction in the long run, which is why we pay attention to macro.
U.S. leading economic indicators are decent right now, which suggests that a recession is not imminent.
Let’s recap some of the leading macro indicators we covered:
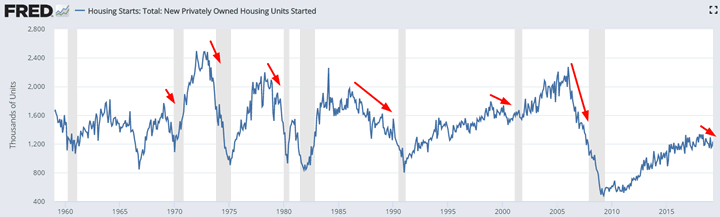
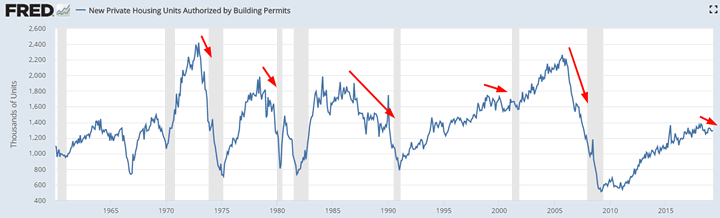
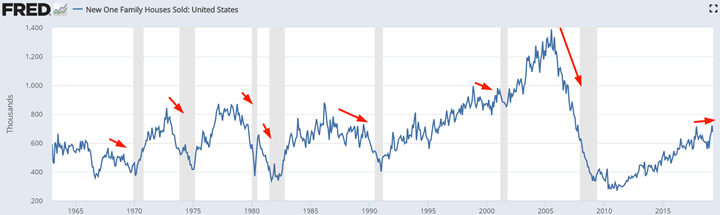
Housing is a slight negative factor, but could improve
Housing – a key leading sector for the economy – remains weak. Housing Starts and Building Permits are trending downwards while New Home Sales is trending sideways. In the past, these 3 indicators trended downwards before recessions and bear markets began.

Labor market is still a positive factor
Despite yesterday’s weak jobs report, the labor market is still a positive factor for macro. Nonfarm payrolls is notoriously noisy from month to month, and it’s very common for nonfarm payrolls to miss expectations during an economic expansion.
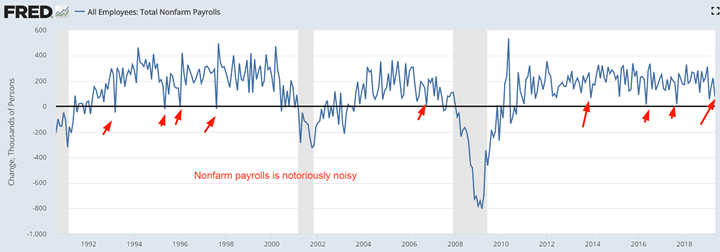
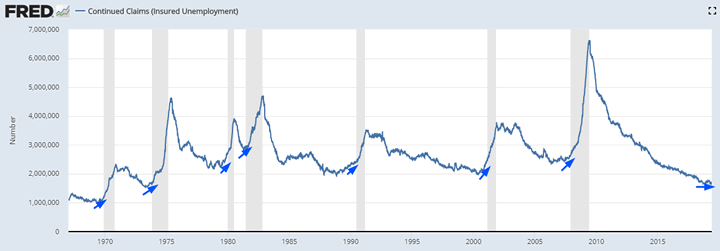
That’s why it’s better to focus on the Unemployment Rate, Initial Claims, and Continued Claims.
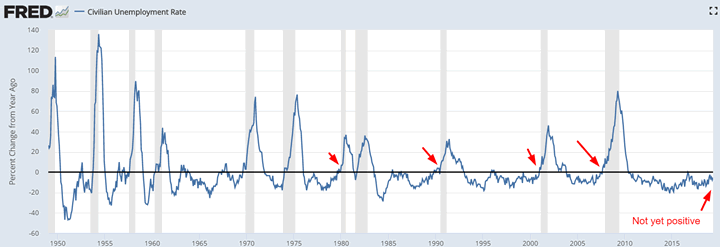
The Unemployment Rate has yet to trend upwards.
- Its 12 month rate-of-change is still negative.
- Its 12 month rate-of-change was positive before prior recessions.
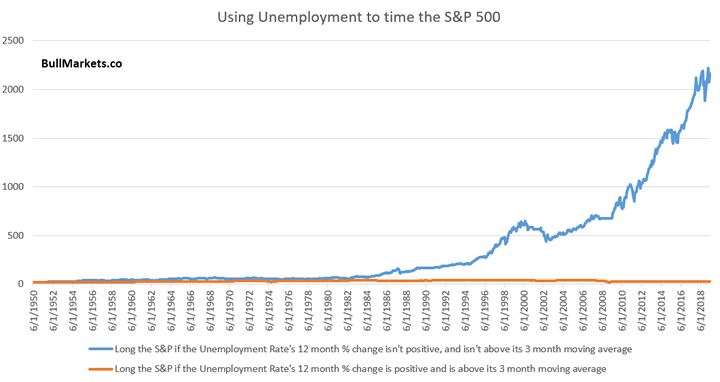
The Unemployment Rate’s 12 month % change being negative (blue line below) is much more bullish for the S&P than when the Unemployment Rate’s 12 month % change is positive (orange line below)
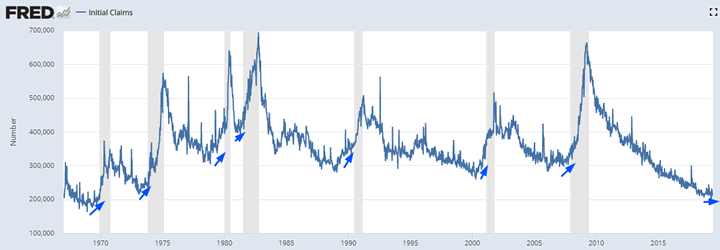
Initial Claims and Continued Claims are trending sideways. In the past, these 2 leading indicators trended higher before bear markets and recessions began.
Financial conditions
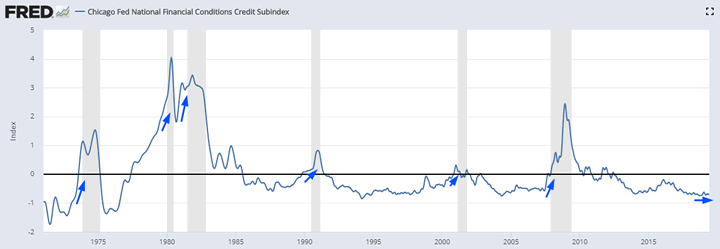
Financial conditions remain very loose and banks have not significantly tightened their lending standards. In the past, financial conditions tightened before recessions and bear markets began.
Here’s the Chicago Fed’s Financial Conditions Credit Subindex
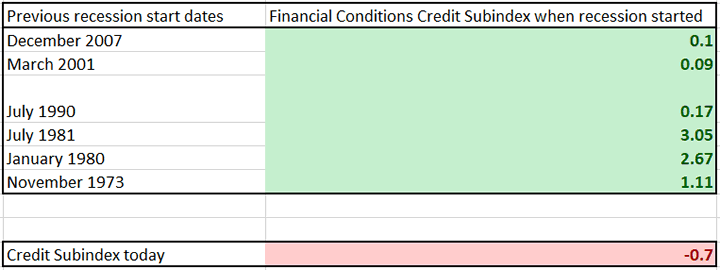
Here’s the Credit Subindex level when historical recessions began.
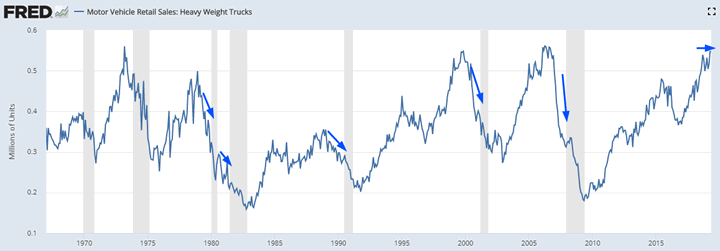
Heavy Truck Sales
Heavy Truck Sales is still trending upwards. In the past, Heavy Truck Sales trended downwards before recessions and bear markets began.
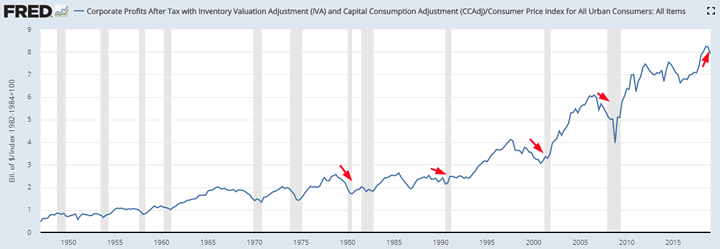
Corporate Profits
The latest reading for inflation-adjusted corporate profits fell. In the past, corporate profits fell before recessions and bear markets began. Since corporate profits leads the S&P by 5-6 quarters, this is a long term bearish factor for the stock market beginning in Q1 2020.
We don’t use our discretionary outlook for trading. We use our quantitative trading models because they are end-to-end systems that tell you how to trade ALL THE TIME, even when our discretionary outlook is mixed. Members can see our model’s latest trades here updated in real-time.
Conclusion
Here is our discretionary market outlook:
- The U.S. stock market’s long term risk:reward is not bullish. In a most optimistic scenario, the bull market probably has 1 year left.
- Most of the medium term market studies (e.g. next 6-9 months) are bullish, although a few of trend following studies are starting to become bearish.
- Market studies over the next 1-2 weeks are mixed (some bullish and some bearish). Trade war news only adds to this uncertainty.
- HOWEVER, our market studies for the next 1-3 months are starting to turn more bullish.
- We focus on the medium-long term.
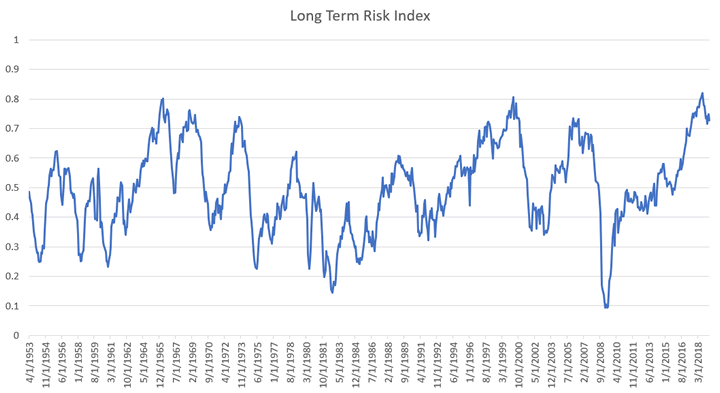
Goldman Sachs’ Bull/Bear Indicator demonstrates that risk:reward does favor long term bears.
Click here for more market analysis
By Troy Bombardia
I’m Troy Bombardia, the author behind BullMarkets.co. I used to run a hedge fund, but closed it due to a major health scare. I am now enjoying life and simply investing/trading my own account. I focus on long term performance and ignore short term performance.
Copyright 2019 © Troy Bombardia - All Rights Reserved
Disclaimer: The above is a matter of opinion provided for general information purposes only and is not intended as investment advice. Information and analysis above are derived from sources and utilising methods believed to be reliable, but we cannot accept responsibility for any losses you may incur as a result of this analysis. Individuals should consult with their personal financial advisors.
Troy Bombardia Archive |
© 2005-2022 http://www.MarketOracle.co.uk - The Market Oracle is a FREE Daily Financial Markets Analysis & Forecasting online publication.