


Investors are Confident, Bullish and Buying Stocks, but…
Stock-Markets / Stock Markets 2019 Jun 18, 2019 - 09:02 AM GMTBy: Chris_Vermeulen

 The Technical Traders Ltd has identified a unique price to volatility relationship between the SP500 and VIX index. The calculations required to compute the VIX index are composed of a number of factors. That final value of the VIX index is reported on an annualized basis. This means that VIX index as already internalized the past 12 months price volatility into the current VIX levels.
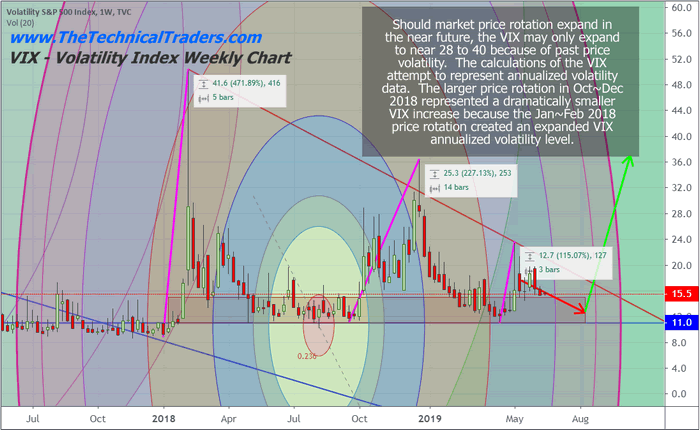
We believe this increased VIX volatility expectation could be muting future VIX spikes and trading systems focus on the VIX Index. The fact that the VIX as likely to internalized that large October to December 2018 price rotation and will not move beyond this price range until well after April or May of 2020 creates a unique problem for VIX systems and analysts. In short, the VIX has normalized a 20% price volatility expectation, or more, and will not reduce this expectation until well after April or May of 2020.
Taking a look at this weekly VIX chart clearly highlights the large 472% increase in January and February 2018. The reason why the VIX increased by this incredible amount is that the prior 12 months price volatility was extremely muted. The price rotation in the SPX was -343, for a total of -12%. The second VIX Spike between October and December of 2018 resulted in a 227% increase while price rotated more than 600 points, -20.61%, in the SPX. Obviously, the larger price movement in October through December 2018 would have likely resulted in a large VIX move if prior volatility expectations had remained the same.
It is our belief that the January to February 2018 price volatility rotation increase the VIX volatility expectations by at least 30 to 40%. The second, much larger, price rotation during October to December 2018 pushed the VIX volatility expectations higher by at least 10 to 15%. Our researchers believe the normalized VIX levels representing current price volatility are likely to stay above 12 or 13 until well after November or December 2019 if price volatility and expectations stay rather muted. Any additional large price rotations, to the downside, will likely continue to normalize or internalize increased VIX level volatility expectations.
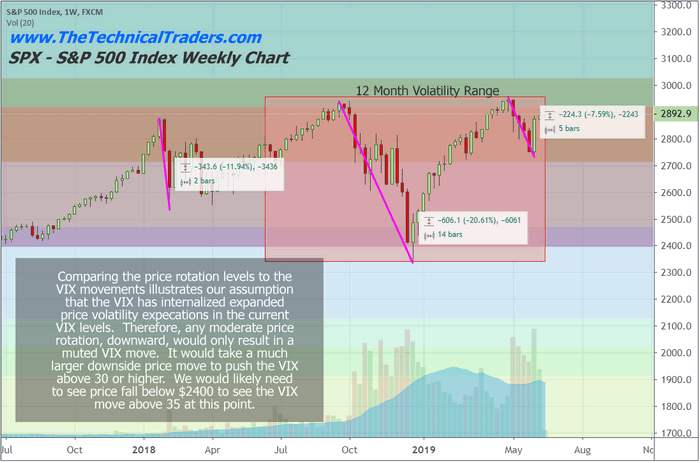
This SPX chart helps to compare the relative VIX price increases in relation to the true SPX price volatility. We’ve also drawn a 12-month price window, as a red box on this chart, to highlight how the VIX attempts to normalize the past 12 months volatility going forward. It is our belief that a move above 500 to 600 points in the SPX may only prompt a rally in the VIX to near 28 to 30. Whereas, the same price swing from October to December 2018 prompted a VIX move to about 36. We would need to see the SPX move at least 900 points before the VIX will spike above 25 again. Remember after January or February of 2020 the VIX may begin to contract again as price volatility stays muted for the rest of this year.
We currently believe a large price rotation may be set up for near the end of 2019. Our proprietary cycle modeling systems and extended research are suggesting this downside move may begin sometime near August or September of 2019. Remember, this new VIX research suggests that any large price downswing may result in a very moderate VIX price increase at first. In other words, things could get very interesting towards the end of 2019 for traders.
Please take a minute to visit www.TheTechnicalTraders.com and see how we have been navigating, trading and profiting from the market over the past 17 months, I think you will be pleasantly surprised. Our research team believes the US stock market will likely form an extended pennant formation over the next 60+ days. Now is the time for us to plan and prepare for what may become a very volatile second half of 2019 and early 2020.
Become A Technical Trader Today Using Our Trade and Investing Signals CLICK HERE
Chris Vermeulen
www.TheTechnicalTraders.com
Chris Vermeulen has been involved in the markets since 1997 and is the founder of Technical Traders Ltd. He is an internationally recognized technical analyst, trader, and is the author of the book: 7 Steps to Win With Logic
Through years of research, trading and helping individual traders around the world. He learned that many traders have great trading ideas, but they lack one thing, they struggle to execute trades in a systematic way for consistent results. Chris helps educate traders with a three-hour video course that can change your trading results for the better.
His mission is to help his clients boost their trading performance while reducing market exposure and portfolio volatility.
He is a regular speaker on HoweStreet.com, and the FinancialSurvivorNetwork radio shows. Chris was also featured on the cover of AmalgaTrader Magazine, and contributes articles to several leading financial hubs like MarketOracle.co.uk
Disclaimer: Nothing in this report should be construed as a solicitation to buy or sell any securities mentioned. Technical Traders Ltd., its owners and the author of this report are not registered broker-dealers or financial advisors. Before investing in any securities, you should consult with your financial advisor and a registered broker-dealer. Never make an investment based solely on what you read in an online or printed report, including this report, especially if the investment involves a small, thinly-traded company that isn’t well known. Technical Traders Ltd. and the author of this report has been paid by Cardiff Energy Corp. In addition, the author owns shares of Cardiff Energy Corp. and would also benefit from volume and price appreciation of its stock. The information provided here within should not be construed as a financial analysis but rather as an advertisement. The author’s views and opinions regarding the companies featured in reports are his own views and are based on information that he has researched independently and has received, which the author assumes to be reliable. Technical Traders Ltd. and the author of this report do not guarantee the accuracy, completeness, or usefulness of any content of this report, nor its fitness for any particular purpose. Lastly, the author does not guarantee that any of the companies mentioned in the reports will perform as expected, and any comparisons made to other companies may not be valid or come into effect.
Chris Vermeulen Archive |
© 2005-2022 http://www.MarketOracle.co.uk - The Market Oracle is a FREE Daily Financial Markets Analysis & Forecasting online publication.