


Precious Metals and Stocks VIX Are About To Pull A “Crazy Ivan”
Stock-Markets / Financial Markets 2019 Aug 11, 2019 - 02:53 PM GMTBy: Chris_Vermeulen

 We’re borrowing a term from the movie Red October (source) that describes an unusual change of direction for a Russian submarine with the intent to seek out enemies and unknown targets – called a “Crazy Ivan”. We are using this term because we believe the markets are about to pull a very unusual “Crazy Ivan” move of their own – reverting to unknown price levels while the US/Global markets attempt to seek out risk, support, resistance and other unknown “revaluation” targets in the process.
Our belief is that a key cycle date, August 19, 2019, will be the start of a breakdown in the US markets that aligns with some outside type of catalyst event. It could be that foreign central banks issue some news or warning at that time or it could be that Asia/China issue some type of catalyst to the event. We don’t know what the catalyst will be but we can guess that it will be related to geopolitics or the global economy/credit/debt issues. God forbid it to be some type of war or human crisis event – we really don’t need that right now.
Please review these earlier research posts for more information :
July 24, 2019: PART II – BLACK HOLE IN GLOBAL BANKING IS BEING EXPOSED
July 24, 2019: SILVER PRICE TARGET DURING THE NEXT BULL MARKET
July 20, 2019: US & GLOBAL MARKETS SETTING UP FOR A VOLATILITY EXPLOSION – ARE YOU READY?
July 13, 2019: MID-AUGUST IS A CRITICAL TURNING POINT FOR US STOCKS
Our job as research analysts is to highlight what we believe is likely to happen and why we believe it is likely to happen. Therefore, without guessing as to the cause of the event, let’s focus on the “Crazy Ivan” event and how we can attempt to profit from it.
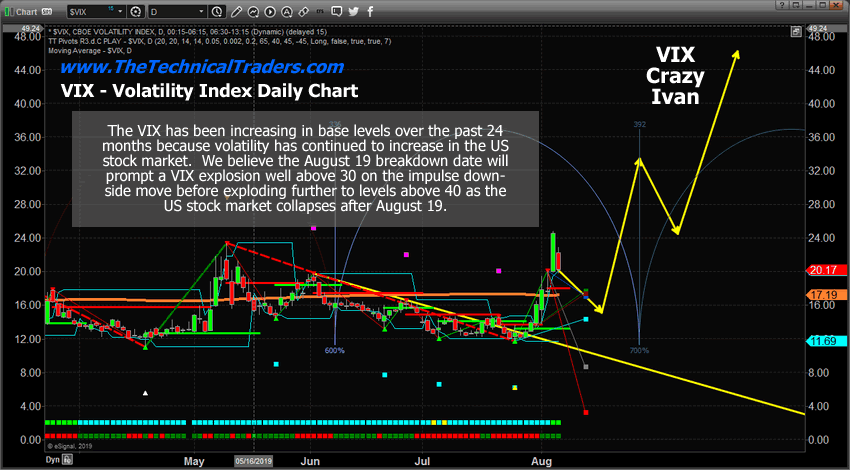
First, let’s take a look at the VIX chart. The VIX basing level (the lowest level the VIX has attained between price spikes) has been increasing as US stock market volatility continues to increase. The nature of the calculations that make up the VIX would suggest this increase in basing levels would happen as extended volatility continues to be present in the markets – so this is expected. What is not expected is the August 19th price inflection point that we believe will drive an unexpected price reversion in the US and global stock markets. We believe this cycle inflection date is key to understanding how the markets will react going into the end of 2019 and beyond.
If our analysis is correct, then we believe a breakdown in the US and global markets will occur on or shortly after August 19, 2019, where the US stock markets are poised for a -15% to -25% price reversion. This downside move in the US stock market would set up an incredible “price anomaly” for skilled technical traders that should provide an incredible opportunity for future profits.
We believe the ultimate downside potential for this move may last all the way through the end of 2019 and into early 2020 – although we can’t be certain yet as to the depth and severity of this move using our predictive modeling tools and utilities. All we know is that it is about to happen based on what our predictive modeling tools are telling us and we have continued to try to warn you of this move for the past few months. So here it is – the Crazy Ivan (as we’re calling it).
Any VIX rally that pushes the price above 30 or 40 would have to be rather severe compared to previous rotations. The spikes on this chart related as follows on the NQ chart :
Early May VIX Spike to 23.31 resulted in a -938.25 point move (-11.91%) in the NQ
The current August VIX spike to 24.80 resulted in a -848.75 point move (-10.54%) in the NQ.
What would a move to above 32 in the VIX look like on the NQ chart? How about a move to above 42 on the VIX? Hello Crazy Ivan.
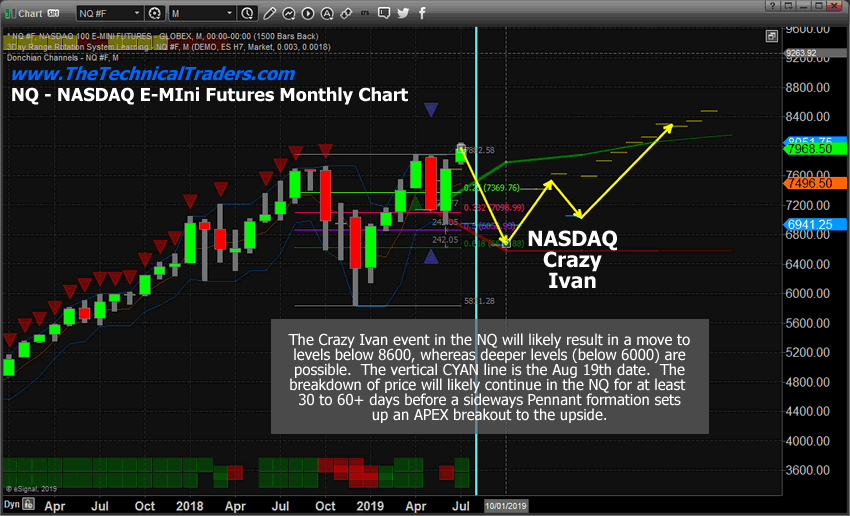
This next chart of the NQ on a monthly basis highlights our Adaptive Dynamic Learning (ADL) predictive modeling system at work. This utility helps us to understand where the price will want to target in the future and also helps us to understand trend and outlying price trends (or price anomalies). Price anomalies happen when price moves substantially away from where the ADL predictive modeling system is suggesting price wants to be at. Thus, if the price of the NQ were to fall below $5500 very quickly (think Crazy Ivan) and our ADL modeling tool suggests that price really wants to be at $6800 at that time, then we have a $3300 price anomaly setting up. This is a type of reactive price anomaly that suggests price is way off target and will attempt to revert to levels closer to the ADL predictive price levels.
We believe the Crazy Ivan event could push the price of the NQ much lower than our ADL predictive modeling system is suggesting and create a price anomaly that may become one of the most profitable trades near the end of 2019.
You can see from this ADL predictive modeling chart that price is expected to be lower near the end of 2019, but steadily climb higher into early 2020. If price were to end up below 6400 by the end of 2019, that would set up a 1000+ point price anomaly setup that could become an incredible upside price move in early 2020. Time will tell as this Crazy Ivan event plays out.
CONCLUDING THOUGHTS:
In the second part of this article, we’ll study the Crazy Ivan event in the metals and show you what we believe will happen to both Gold and Silver as this event plays out. You won’t want to miss this one.
WARNING SIGNS ABOUT GOLD, SILVER, MINERS, AND S&P 500
In early June I posted a detailed video explaining in showing the bottoming formation and gold and where to spot the breakout level, I also talked about crude oil reaching it upside target after a double bottom, and I called short term top in the SP 500 index. This was one of my premarket videos for members it gives you a good taste of what you can expect each and every morning before the Opening Bell. Watch Video Here.
I then posted a detailed report talking about where the next bull and bear markets are and how to identify them. This report focused mainly on the SP 500 index and the gold miners index. My charts compared the 2008 market top and bear market along with the 2019 market prices today. See Comparison Charts Here.
On June 26th I posted that silver was likely to pause for a week or two before it took another run up on June 26. This played out perfectly as well and silver is now head up to our first key price target of $17. See Silver Price Cycle and Analysis.
More recently on July 16th, I warned that the next financial crisis (bear market) was scary close, possibly just a couple weeks away. The charts I posted will make you really start to worry. See Scary Bear Market Setup Charts.
Become a technical trader and profit like a pro! Click Here
Chris Vermeulen
www.TheTechnicalTraders.com
Chris Vermeulen has been involved in the markets since 1997 and is the founder of Technical Traders Ltd. He is an internationally recognized technical analyst, trader, and is the author of the book: 7 Steps to Win With Logic
Through years of research, trading and helping individual traders around the world. He learned that many traders have great trading ideas, but they lack one thing, they struggle to execute trades in a systematic way for consistent results. Chris helps educate traders with a three-hour video course that can change your trading results for the better.
His mission is to help his clients boost their trading performance while reducing market exposure and portfolio volatility.
He is a regular speaker on HoweStreet.com, and the FinancialSurvivorNetwork radio shows. Chris was also featured on the cover of AmalgaTrader Magazine, and contributes articles to several leading financial hubs like MarketOracle.co.uk
Disclaimer: Nothing in this report should be construed as a solicitation to buy or sell any securities mentioned. Technical Traders Ltd., its owners and the author of this report are not registered broker-dealers or financial advisors. Before investing in any securities, you should consult with your financial advisor and a registered broker-dealer. Never make an investment based solely on what you read in an online or printed report, including this report, especially if the investment involves a small, thinly-traded company that isn’t well known. Technical Traders Ltd. and the author of this report has been paid by Cardiff Energy Corp. In addition, the author owns shares of Cardiff Energy Corp. and would also benefit from volume and price appreciation of its stock. The information provided here within should not be construed as a financial analysis but rather as an advertisement. The author’s views and opinions regarding the companies featured in reports are his own views and are based on information that he has researched independently and has received, which the author assumes to be reliable. Technical Traders Ltd. and the author of this report do not guarantee the accuracy, completeness, or usefulness of any content of this report, nor its fitness for any particular purpose. Lastly, the author does not guarantee that any of the companies mentioned in the reports will perform as expected, and any comparisons made to other companies may not be valid or come into effect.
Chris Vermeulen Archive |
© 2005-2022 http://www.MarketOracle.co.uk - The Market Oracle is a FREE Daily Financial Markets Analysis & Forecasting online publication.