


Stock Market VIX To Begin A New Uptrend and What it Means
Stock-Markets / Stock Markets 2019 Sep 17, 2019 - 06:32 PM GMTBy: Chris_Vermeulen

 The news of the drone attack on Saudi Arabia over the weekend prompted a big upside move in Oil (over 10%) and a moderate downside rotation in the US major indexes/stock market. Although prices had recovered slightly by the opening bell on Monday, September 16, the shock wave resulting from this disruption in oil supply is just now starting to play out.
The long term uncertainty in the markets, as well as the rotation in the US Dollar and other foreign currencies, could play a bigger role in the type of volatility and extent of the immediate price rotation that may result from this external news event. Our VIX predictions and ADL predictive modeling system are suggesting volatility will become front and center over the next 60+ day before settling into a more narrow price range.
As we see it, this disruption in oil is an external factor related to the markets. Yes, it will disrupt about 5% of the global oil supply. Yes, some type of retaliation could take place over the next 30 to 60 days. Yes, the global markets will continue to rotate until they have priced in the additional risk related to this current event and potential future events. That means investors must understand the value and opportunity of proper position sizing and risk management. The next few weeks may be full of surprises.
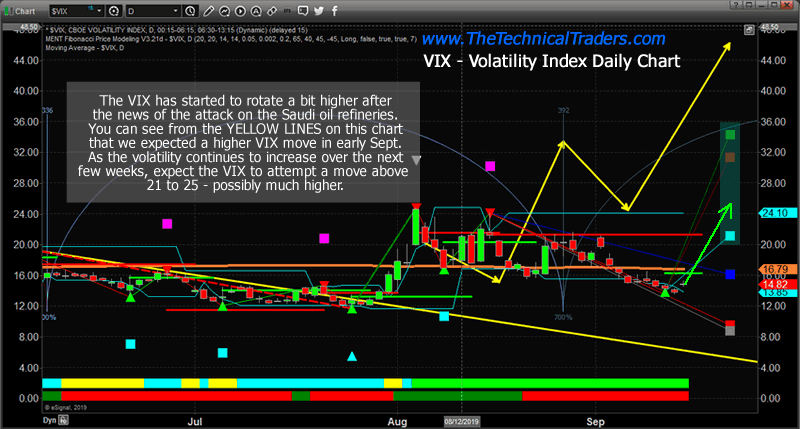
VIX Index Fibonacci Upside Targets Chart
Our VIX chart highlights what we expect in terms of the potential upside price volatility in the US stock market. You can see we expected the VIX price to decline after the peak in early August 2019, then bottom near August 20~21 and attempt a move higher (related to our August 19 breakdown expectations). This breakdown never happened as news events pushed the general markets higher – abating the spike in the VIX we were expecting. Our further expectations were that VIX would cycle lower near the end of August 2019 and into very early September 2019 before setting up a bottom near 24 and extending higher. Obviously, our expected levels were off by quite a bit, but the rotation in the VIX continues to align with our rotational cycles.
Therefore, we believe the potential for an upside price move in the VIX is still very valid, especially given the events of last weekend and the continued trade talks, market fragility and potential for major news events. We believe the VIX may be starting an upward price cycle that could push it well past 21~24 should the US stock markets rotate lower or contract.
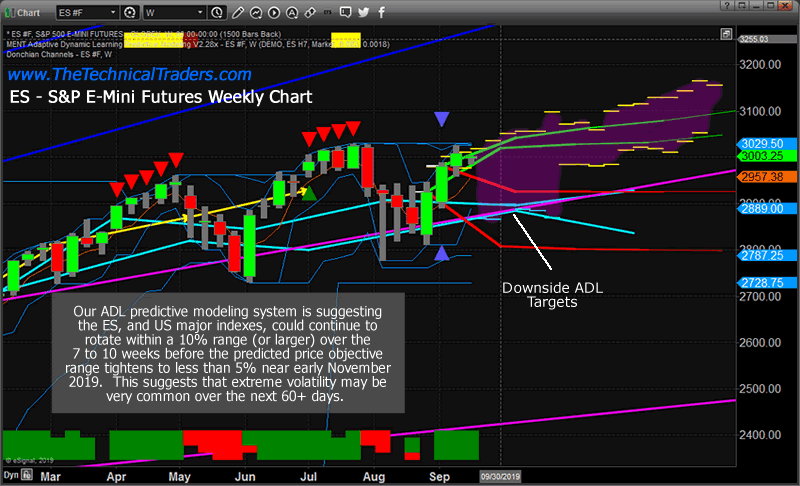
SP500 Index Weekly Adaptive Dynamic Learning (ADL) Chart
Our ES Weekly Adaptive Dynamic Learning (ADL) chart highlights why we believe an extended volatility range exists over the next 60+ days and why we believe a rotation of 8 to 12% is a real possibility in the US stock market/major indexes. Our ADL predictive modeling system is very useful because it highlights where price may attempt to target out into the future based on a proprietary price mapping/data mining solution. The purpose of this tool is to map historical price activity by unique price pattern, technical data and categories, learn from the past and attempt to use this data to predict the future. We’ve found it to be extremely valuable in our research.
This ES Weekly ADL chart suggests an 8 to 12% price range is set up in the US stock markets over the next 60+ days. This suggests that and price weakness or external news event could send the US stock market much lower before finding any real support. Any absence of this breakdown event or crisis-type news event would suggest that prices will attempt to drift moderately higher over the next 60+ days.
In other words, there is a very real potential for a potentially big downside price rotation currently set up in the markets. That potential vanishes in early November 2019 as the ADL predictive modeling system suggests a more narrow target range for the price with an upside price bias driving markets to potentially new all-time highs.
Concluding Thought:
Get ready for some really great trading opportunities over the next 4+ months. Any downside price rotation will present a very clear buying opportunity for skilled technical traders and members of our ETF Wealth Building Newsletteras we lead into the November/December market rally (Christmas Rally). This means we must continue to be cautious of extended volatility and play these price rotations with a strong focus on managing risk before the November/December rally sets up to close out 2019.
As a technical analysis and trader since 1997, I have been through a few bull/bear market cycles. I believe I have a good pulse on the market and timing key turning points for both short-term swing trading and long-term investment capital. The opportunities are massive/life-changing if handled properly.
So, if you believe in technical analysis, then this is the newsletter and market condition for you to really shine.
Be prepared for these price swings before they happen and learn how you can identify and trade these fantastic trading opportunities in 2019, 2020, and beyond with our Wealth Building & Global Financial Reset Newsletter.
Join me with a 1 or 2-year subscription to lock in the lowest rate possible and ride my coattails as I navigate these financial market and build wealth while others lose nearly everything they own during the next financial crisis.
FREE GOLD OR SILVER WITH SUBSCRIPTION!
Chris Vermeulen
www.TheTechnicalTraders.com
Chris Vermeulen has been involved in the markets since 1997 and is the founder of Technical Traders Ltd. He is an internationally recognized technical analyst, trader, and is the author of the book: 7 Steps to Win With Logic
Through years of research, trading and helping individual traders around the world. He learned that many traders have great trading ideas, but they lack one thing, they struggle to execute trades in a systematic way for consistent results. Chris helps educate traders with a three-hour video course that can change your trading results for the better.
His mission is to help his clients boost their trading performance while reducing market exposure and portfolio volatility.
He is a regular speaker on HoweStreet.com, and the FinancialSurvivorNetwork radio shows. Chris was also featured on the cover of AmalgaTrader Magazine, and contributes articles to several leading financial hubs like MarketOracle.co.uk
Disclaimer: Nothing in this report should be construed as a solicitation to buy or sell any securities mentioned. Technical Traders Ltd., its owners and the author of this report are not registered broker-dealers or financial advisors. Before investing in any securities, you should consult with your financial advisor and a registered broker-dealer. Never make an investment based solely on what you read in an online or printed report, including this report, especially if the investment involves a small, thinly-traded company that isn’t well known. Technical Traders Ltd. and the author of this report has been paid by Cardiff Energy Corp. In addition, the author owns shares of Cardiff Energy Corp. and would also benefit from volume and price appreciation of its stock. The information provided here within should not be construed as a financial analysis but rather as an advertisement. The author’s views and opinions regarding the companies featured in reports are his own views and are based on information that he has researched independently and has received, which the author assumes to be reliable. Technical Traders Ltd. and the author of this report do not guarantee the accuracy, completeness, or usefulness of any content of this report, nor its fitness for any particular purpose. Lastly, the author does not guarantee that any of the companies mentioned in the reports will perform as expected, and any comparisons made to other companies may not be valid or come into effect.
Chris Vermeulen Archive |
© 2005-2022 http://www.MarketOracle.co.uk - The Market Oracle is a FREE Daily Financial Markets Analysis & Forecasting online publication.