


Near-term bearish signs for Bitcoin Cash
Currencies / Bitcoin Nov 01, 2019 - 03:37 PM GMTBy: MarketsToday

 Summary
- Bearish doji candlestick pattern occurs after seven days up.
- Occurs on test of neckline of large bearish head & shoulders topping pattern.
- Potentially significant drop possible to below most recent swing low.
A bearish daily Doji candlestick pattern occurs in Bitcoin Cash (BCH/USD) following seven days up, while a potential 1-day reversal triggered with a break below the candle’s low. This is the first time in eight days that price has dropped below the prior day’s low and is a clear change in the pattern of higher daily lows and higher daily highs.
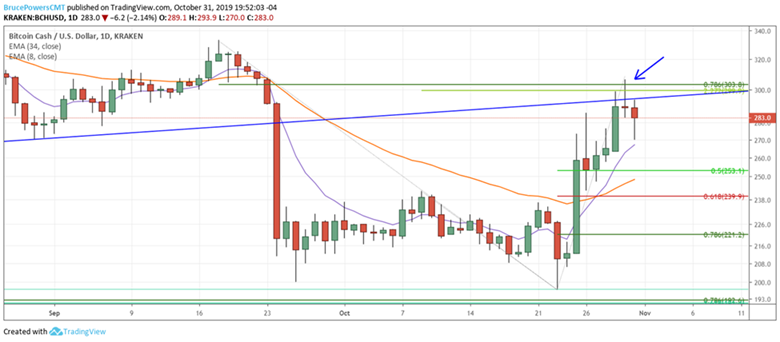
The potential topping pattern occurs in an area of potential resistance identified by:
- Neckline resistance of large bearish head and shoulder top pattern (HS).
- Area of 78.6% Fibonacci retracement of most recent swing high to low decline.
- Bearish 14-period divergence occurs on 4-hour chart.
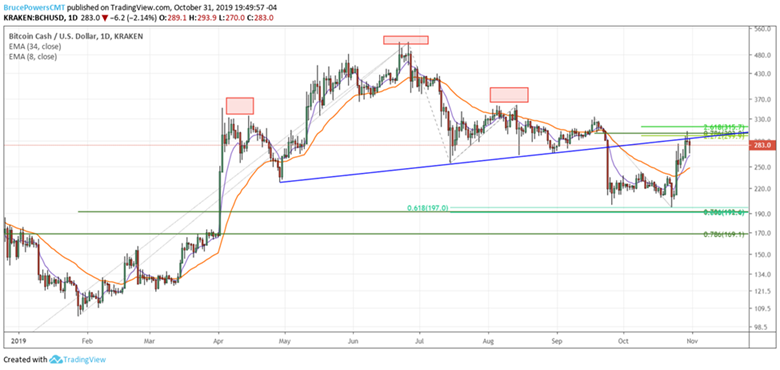
Most recent low to $196.80 was not close to reaching the measuring objective based on a percentage measurement, of approximately $144.54. Therefore, this pair has the potential to fall well below the most recent swing low. This doesn’t mean that it will, just that it could.
A move above the most recent trend high at $306.70 will negate the above potentially bearish analysis.
Bruce Powers, CMT
Chief Technical Analyst
http://www.marketstoday.net/
© 2019 Copyright Bruce Powers- All Rights Reserved
Disclaimer: The above is a matter of opinion provided for general information purposes only and is not intended as investment advice. Information and analysis above are derived from sources and utilising methods believed to be reliable, but we cannot accept responsibility for any losses you may incur as a result of this analysis. Individuals should consult with their personal financial advisors.
© 2005-2022 http://www.MarketOracle.co.uk - The Market Oracle is a FREE Daily Financial Markets Analysis & Forecasting online publication.