


How to Use Price Cycles and Profit as a Swing Trader – SPX, Bonds, Gold, Nat Gas
Stock-Markets / Financial Markets 2019 Nov 13, 2019 - 11:33 PM GMTBy: Chris_Vermeulen

 News does drive certain market events and we understand how certain traders rely on news or interest rates to bias their positions and trades. As technical analysis purists, so to say, we believe the price operates within pure constructs of price rotation theory, trend theory, technical indicator theory, and price cycles. We’ve found that technical analysis distills many news items into pure technical trading signals that we can use to profit from market swings.
Price is the ultimate indicator in our view. Price determines current trends, support/resistance levels/channels, past price peaks and troughs and much more. When we apply our proprietary price modeling and price cycle tools, we can gain a very clear picture of what price may attempt to do in the near future and even as far as a few months into the future. Price, as the ultimate indicator, truly is the mathematical core element of all future price activity, trends, and reversions. Before you continue reading make sure to opt-in to our free market trend signals newsletter.
We have been using cycles since 2011 and have developed multiple proprietary price modeling tools over the past 5+ years that assist us in finding and timing great trades. Most of what we have learned over the past 8+ years is refined into “experience and skill”. When you follow the markets every day – every hour, for the past 8+ years and see various types of price and technical indicator setups and reactions, you learn to hone into certain setups that have proven to be highly accurate trading triggers.
Our research team had dedicated thousands of hours to develop the tremendous skills and experience to be able to produce accurate cycles, and to also interpret them, which is what we specialize in doing. Determining which cycles to trade may look simple, yet they are far from easy to trade without the setups and price rotation signals.
We use a blend of the top 4 active price cycles in the market which updates daily. This data allows us to know where future price is likely to move over the next few days and weeks. Within this article, we’ll show you some of our proprietary price cycles and modeling tools to show you how we run some of our specialized trading tools.
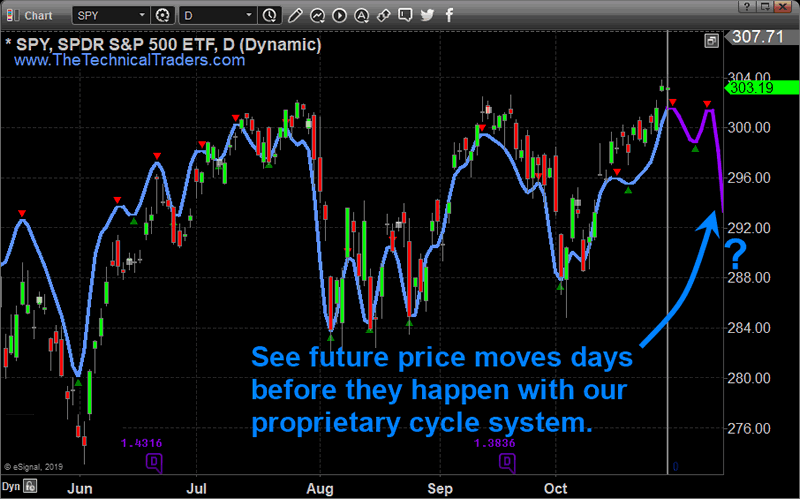
SP500 Daily Chart – Predicted Price Movement
This SPY chart highlights the short-term price cycle modeling system where you can see how price reacted in alignment with our proprietary cycle tool. If you look into the future, you can see that our proprietary price cycle tool is predicting the SPY may cycle into a potential double-top type of formation before cycling lower approximately 8+ days into the future. One thing to remember is these cycle levels do not predict price target levels. Don’t look at this chart and the cycle tool lines as price objectives – they are just trending bias levels scaled from 0 to 100 – just like a SINE WAVE. Ideally, in order to identify price targets, we must fall back to technical price theory and Fibonacci price theory in order to identify target price objectives for the top formation and the potential downside price trend in the future.
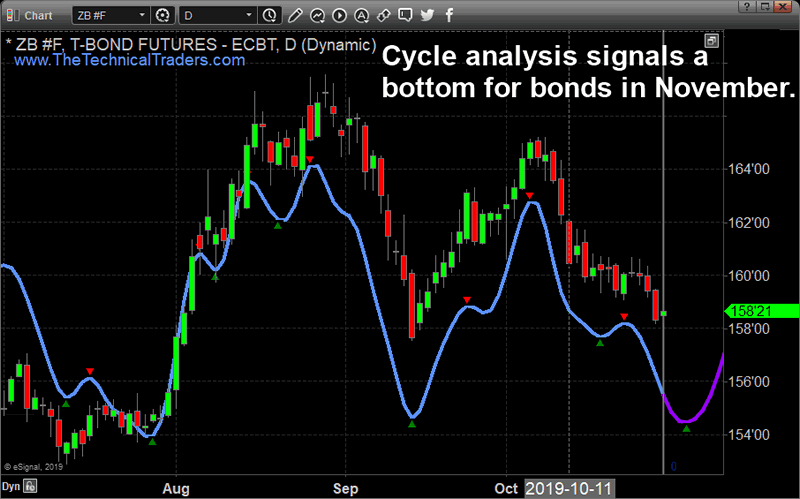
Bonds Daily Chart – Predicted Price Movement
This BOND Daily chart highlights a different type of price cycle – a momentum base/bottom type of setup. You can see from our proprietary cycle tool lines on the chart how price movement has aligned almost perfectly with the cycle forecast. Also, please notice how the price has moved beyond cycle highs and lows at times. This relates to the fact that we discussed above – that cycles do not predict price objectives. On this chart, a longer-term momentum base/bottom setup appears to be forming over the next 8+ days where the Bonds may begin a new upside price trend after the base/bottom forms. This would indicate that we should be looking for opportunities and price triggers that set up after the bottom has setup – not before. If we time our entry properly, we may negate any real risk for a trade with Bonds.
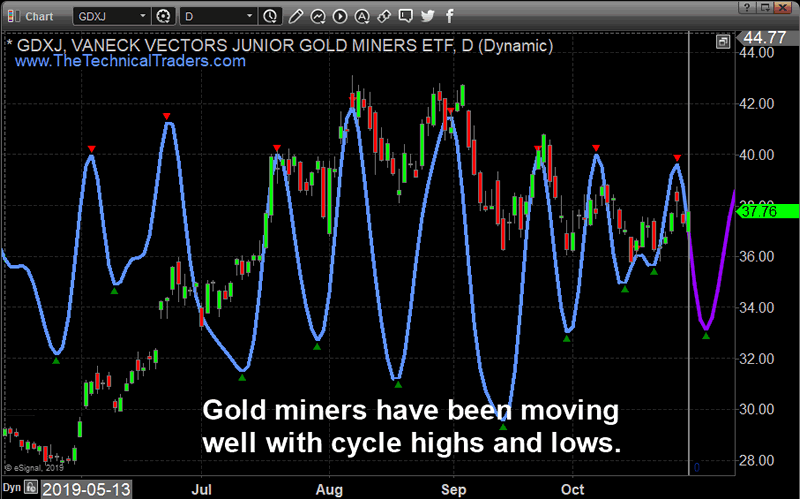
Gold Miners Daily Chart – Predicted Price Movement
This Daily GDXJ chart almost perfectly highlights how the cycles do not align with real price objectives. Throughout most of this chart, you can see the cycle levels rotate higher and lower near the extremes while price rotated in a much more narrow range. Still, pay attention to how our proprietary cycle tool nailed nearly every rotation in price. The range of the cycle lines is indicative of the scale and scope of the total cycle event. Bigger cycle ranges suggest deeper, more volatile price trending events.
Notice how the current cycle ranges are much more narrow than the previous cycle ranges? This suggests the current price cycle event may be more muted and smaller in volatility than previous price cycle ranges.
Our proprietary price cycle tool is suggesting that GDXJ will rotate lower to setup a moderate-term price bottom before attempting to move higher over the next 8 to 10+ days. The upside price cycle may be rather muted as well – possibly only targeting recent price peaks near $40~42.
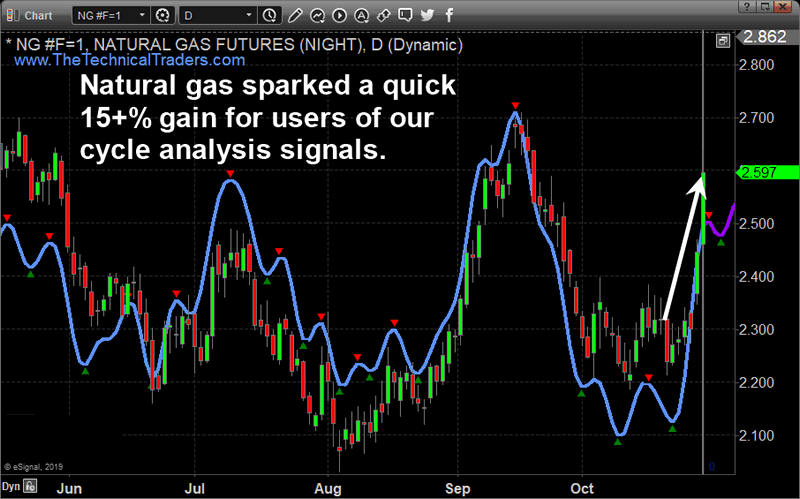
Natural Gas Daily Chart – Predicted Price Movement
As you can see our past cycle analysis has been extremely accurate. In, fact natural gas can provide some of the largest and quickest gains out of all asset classes we cover. In August we traded natural gas for a quick 24% profit, and in October we have already locked in 15% again. Our remaining position in Natural Gas is up even more after this incredible upside move predicted by our cycle tool.
This chart presents a very good example of how our proprietary cycle tool can align with price perfectly at times. In this example, the expected cycle ranges, which highlight the intensity and potential volatility of the price trends, aligned almost perfectly with the real price action. Currently, the cycle tool is predicting a moderate price rotation in Natural Gas before a further upside price move hits.
I can tell you that huge moves are about to start unfolding not only in metals, or stocks but globally and some of these super-cycles are going to last years. A gentleman by the name of Brad Matheny goes into great detail with his simple to understand charts and guide about this. His financial market research is one of a kind and a real eye-opener. PDF guide: 2020 Cycles – The Greatest Opportunity Of Your Lifetime
Concluding Thoughts:
Opportunities are all around us. Using the right tools to identify the true technical cycles, price cycles, and trading setup can help to eliminate risks and hone into more profitable trades. It is almost impossible to time market tops and bottoms accurately, yet, as you can see from our work above, we have tools that can help us see into the future and help to predict when major price peaks and valleys may form. Using a tool like this to help you determine when the real opportunity exists and when to time your trades will only improve your market insights and trading results….
As a technical analysis and trader since 1997, I have been through a few bull/bear market cycles. I believe I have a good pulse on the market and timing key turning points for both short-term swing trading and long-term investment capital. The opportunities are massive/life-changing if handled properly.
Chris Vermeulen
www.TheTechnicalTraders.com
Chris Vermeulen has been involved in the markets since 1997 and is the founder of Technical Traders Ltd. He is an internationally recognized technical analyst, trader, and is the author of the book: 7 Steps to Win With Logic
Through years of research, trading and helping individual traders around the world. He learned that many traders have great trading ideas, but they lack one thing, they struggle to execute trades in a systematic way for consistent results. Chris helps educate traders with a three-hour video course that can change your trading results for the better.
His mission is to help his clients boost their trading performance while reducing market exposure and portfolio volatility.
He is a regular speaker on HoweStreet.com, and the FinancialSurvivorNetwork radio shows. Chris was also featured on the cover of AmalgaTrader Magazine, and contributes articles to several leading financial hubs like MarketOracle.co.uk
Disclaimer: Nothing in this report should be construed as a solicitation to buy or sell any securities mentioned. Technical Traders Ltd., its owners and the author of this report are not registered broker-dealers or financial advisors. Before investing in any securities, you should consult with your financial advisor and a registered broker-dealer. Never make an investment based solely on what you read in an online or printed report, including this report, especially if the investment involves a small, thinly-traded company that isn’t well known. Technical Traders Ltd. and the author of this report has been paid by Cardiff Energy Corp. In addition, the author owns shares of Cardiff Energy Corp. and would also benefit from volume and price appreciation of its stock. The information provided here within should not be construed as a financial analysis but rather as an advertisement. The author’s views and opinions regarding the companies featured in reports are his own views and are based on information that he has researched independently and has received, which the author assumes to be reliable. Technical Traders Ltd. and the author of this report do not guarantee the accuracy, completeness, or usefulness of any content of this report, nor its fitness for any particular purpose. Lastly, the author does not guarantee that any of the companies mentioned in the reports will perform as expected, and any comparisons made to other companies may not be valid or come into effect.
Chris Vermeulen Archive |
© 2005-2022 http://www.MarketOracle.co.uk - The Market Oracle is a FREE Daily Financial Markets Analysis & Forecasting online publication.