


$EWC iShares MSCI Canada ETF Long Term Cycles & Elliott Wave
Stock-Markets / Canada Nov 27, 2019 - 03:19 PM GMT

Firstly the EWC instrument inception date was 3/12/1996. The iShares MSCI Canada ETF seeks to track the investment results of an index composed of large and mid-sized companies in Canada. This is of course reflected in the price. The best Elliott Wave reading of the long term cycles in $EWC iShares MSCI Canada ETF must presume some lower prices that did not exist prior to the ETF fund inception date.
Shown on the monthly chart, the bullish cycle from all time lows is believed to have ended in November 2007. This is mostly in line with many other broad based ETF’s and indices that ended larger cycles near that time. Likewise the steep pullback lower into the March 2009 lows replicated the pullbacks in other ETF & indices instruments. This pullback was strong enough to suggest it had corrected the cycle up from the all time lows. The analysis and commentary continues below the EWC Monthly chart.
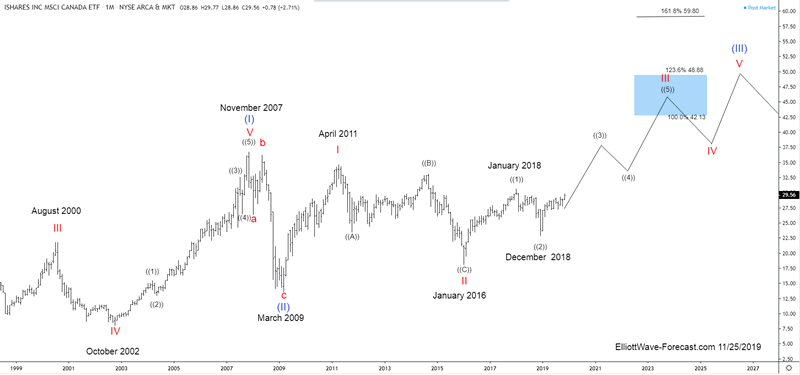
Secondly the bounce from the March 2009 lows has not got back above the November 2007 highs as of yet. Compared to other instruments it is lagging. That not to say it will not catch up it is just the way it works out. EWC bounces higher as related instruments are going higher however at a slower pace. Similarly, the instrument corrects cycles in pullbacks lower when the related instruments are doing the same.
The analysis and conclusion as mentioned earlier; Price has not got above the November 2007 highs yet. As the above chart shows it will eventually however will take some time. The cycles remain bullish and the instrument should proceed higher with the related other countries ETF’s and indices reflecting the improvements in the progression of mankind.
Thanks for looking. Feel free to come visit our website. Please check out our services free for 14 days and see if we can be of help. Kind regards & good luck trading. Lewis Jones of the ElliottWave-Forecast.com Team
By EWF Lewis
https://elliottwave-forecast.com
ElliottWave-Forecast has built its reputation on accurate technical analysis and a winning attitude. By successfully incorporating the Elliott Wave Theory with Market Correlation, Cycles, Proprietary Pivot System, we provide precise forecasts with up-to-date analysis for 52 instruments including Forex majors & crosses, Commodities and a number of Equity Indices from around the World. Our clients also have immediate access to our proprietary Actionable Trade Setups, Market Overview, 1 Hour, 4 Hour, Daily & Weekly Wave Counts. Weekend Webinar, Live Screen Sharing Sessions, Daily Technical Videos, Elliott Wave Setup .
Copyright © 2019 ElliottWave-Forecast - All Rights Reserved Disclaimer: The above is a matter of opinion provided for general information purposes only and is not intended as investment advice. Information and analysis above are derived from sources and utilising methods believed to be reliable, but we cannot accept responsibility for any losses you may incur as a result of this analysis. Individuals should consult with their personal financial advisors.
© 2005-2022 http://www.MarketOracle.co.uk - The Market Oracle is a FREE Daily Financial Markets Analysis & Forecasting online publication.