


Corporate Earnings Setup Rally To Stock Market Peak
Companies / Corporate Earnings Jan 21, 2020 - 06:26 PM GMTBy: Chris_Vermeulen

Our research team believes the current Q4-2019 earnings season and expectations are prompting a “Rally To A Peak”. We’ve been warning our followers and clients that we believe the US Stock Market has rallied to levels that constitute a “near peak enthusiasm” related to historical price volatility.
As you’ll see from these charts, below, we are not dismissing this current upside rally and the potential that it could last for many weeks or months longer – we’re just warning our followers and clients that we believe a very volatile period or price rotation is setting up within the next 10 to 25+ days as prices reach the historical upper boundary.
Our researchers believe that price channels are a very common form of technical analysis. Price enters a channel when defined boundaries are established and when price continues to rotate within these boundaries. Historically, when a price channel is broken or breached, a new price channel is quickly established. You’ll see examples of this very clearly in the Custom US Stock Market Index and Custom Volatility charts below.
Within this research post, we want to highlight the rally levels across a number of our Custom Index charts because we believe the current US stock market rally is nearing a “peaking level/process” that may surprise many investors. Even though the current price trend may be quite stable to the upside, price tends to rotate in up and down price cycles throughout shorter and longer-term trends. We have termed this “true price exploration”. It is the basis of the Elliot Wave theory and Fibonacci price theory. The price must always attempt to establish new price highs or new price lows – at all times.
Put in more simple terms, the price will always rotate up and down within a trend – it will never go straight up or straight down. There must be some rotation in price as support and resistance levels are established while true price exploration is taking place. This process is the reason that we believe the global markets are setting up for a moderate price rotation/reversion in the near future.
This first chart, our Custom US Stock Market Index Weekly chart, highlights the recent upside price breakout that took place late in 2019. We believe this rally is the result of a continued Capital Shift into the US stock market by foreign investors as well as continued fundamental economic data as a result of President Trump’s tax and deregulation policies. The US/China trade deal, beginning to settle in November 2019, was also very good news for the markets overall. As technical investors, these massive global concerns or positive events play a big role in understanding how the price will bias as it digests these positive or negative events.
The one aspect of this Custom US Stock Market Index chart we want to focus everyone onto is the Price Channel that we’ve drawn across the peaks and troughs of price over the past 2+ years. The downside price rotation late in 2019 setup a defined price channel that we believe will act as critical price resistance in the very near future. Should this price rally continue for another 2+ weeks, the price will very likely reach this resistance level – then what?
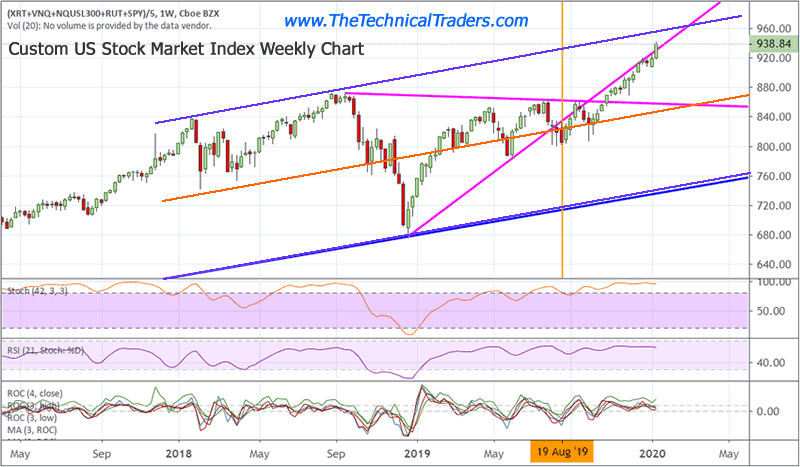
The current upside price rally technically confirms that price has already established a “new price high” and if this resistance level is a strong as we believe, based on the historical price channel structure, it may prompt a moderately large price correction/reversion event. Once price rallies to near the upper price boundary, there is a very strong likelihood that price will experience hard resistance. A potential rotation in price could prompt a move below 880 – the middle price channel level.
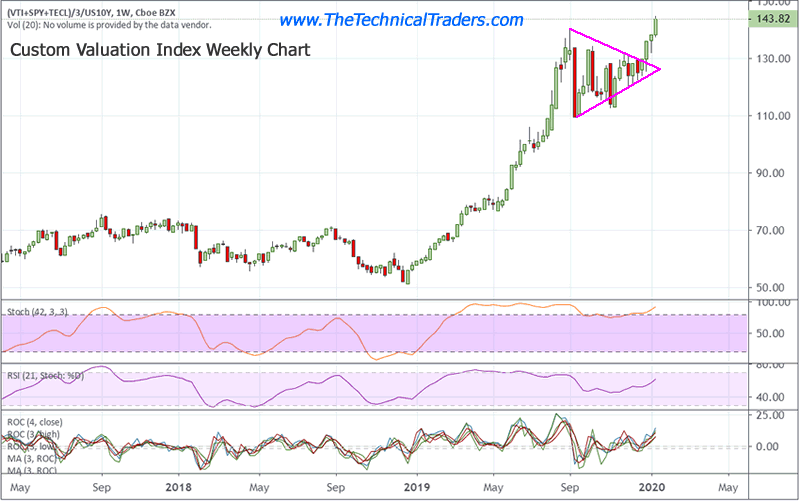
Our Custom Valuation Index Weekly chart highlights the amount of capital pouring into the markets and the fact that global investors continue to believe the upside price rally in the US stock market is likely to continue. The past FLAG formation, from September 2019 till near November 2019, suggested that global investors were quite concerned about future valuation growth. It would appear that global investors began to become very cautious in September 2019 – then started pouring capital back into the markets in late November/early December 2019. It was likely foreign investors that began pouring capital into the US markets at that time.
Either way, the advance in the price of our Custom Valuation Index suggests that global investors believe the US stock market is, again, in rally mode into early 2020 and through Q4 2019 Earnings.
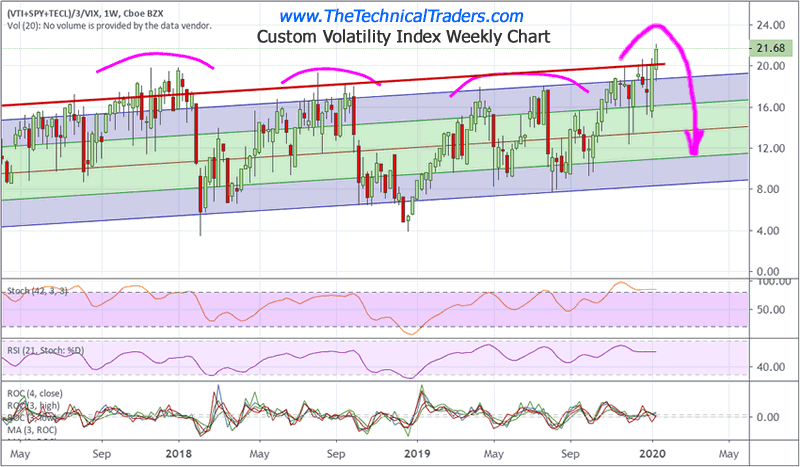
Now for the kicker. Our Custom Volatility Weekly chart is back into extreme overbought territory. This indicator can stay in this range as price advances for many weeks – like what happened in late 2018. Over the past 24+ months, every time the Volatility Index moved up into these extreme overbought levels, a moderate to severe price rotation/reversion took place. This is important to understand for all traders.
Price could attempt to stay up in this overbought level for many weeks or months – yet the risk of a price correction/reversion would only gain strength the longer the Volatility Index stays above 19. Be prepared for increased volatility over the next 60+ days and be prepared for a potential price reversion. Our researchers believe we are very close to critical price resistance and an explosion in volatility.
As skilled technical traders, this is exactly what we want to see happen. We want to be able to find and identify profitable price trends, prepare for price corrections and attempt to time our entries into various ETFs and sectors to be able to profit from these bigger swings. As the rally continues to push higher, pay attention to the earnings data that is release and expect volatility to begin to move higher. We believe a number of earning surprises are going to hit the markets. These could prompt some 2% or greater price swings in the US markets.
This is the year you really want to find the right team to help you identify and trade these bigger trends. Don’t let 2020 pass you by while these incredible setups continue to roll into bigger market trends. Visit www.TheTechnicalTraders.com to learn how we can help you find and execute better trades.
Join my Wealth Building Newsletter if you like what you read here and ride my coattails as I navigate these financial markets and build wealth while others lose nearly everything they own.
Chris Vermeulen
www.TheTechnicalTraders.com
Chris Vermeulen has been involved in the markets since 1997 and is the founder of Technical Traders Ltd. He is an internationally recognized technical analyst, trader, and is the author of the book: 7 Steps to Win With Logic
Through years of research, trading and helping individual traders around the world. He learned that many traders have great trading ideas, but they lack one thing, they struggle to execute trades in a systematic way for consistent results. Chris helps educate traders with a three-hour video course that can change your trading results for the better.
His mission is to help his clients boost their trading performance while reducing market exposure and portfolio volatility.
He is a regular speaker on HoweStreet.com, and the FinancialSurvivorNetwork radio shows. Chris was also featured on the cover of AmalgaTrader Magazine, and contributes articles to several leading financial hubs like MarketOracle.co.uk
Disclaimer: Nothing in this report should be construed as a solicitation to buy or sell any securities mentioned. Technical Traders Ltd., its owners and the author of this report are not registered broker-dealers or financial advisors. Before investing in any securities, you should consult with your financial advisor and a registered broker-dealer. Never make an investment based solely on what you read in an online or printed report, including this report, especially if the investment involves a small, thinly-traded company that isn’t well known. Technical Traders Ltd. and the author of this report has been paid by Cardiff Energy Corp. In addition, the author owns shares of Cardiff Energy Corp. and would also benefit from volume and price appreciation of its stock. The information provided here within should not be construed as a financial analysis but rather as an advertisement. The author’s views and opinions regarding the companies featured in reports are his own views and are based on information that he has researched independently and has received, which the author assumes to be reliable. Technical Traders Ltd. and the author of this report do not guarantee the accuracy, completeness, or usefulness of any content of this report, nor its fitness for any particular purpose. Lastly, the author does not guarantee that any of the companies mentioned in the reports will perform as expected, and any comparisons made to other companies may not be valid or come into effect.
Chris Vermeulen Archive |
© 2005-2022 http://www.MarketOracle.co.uk - The Market Oracle is a FREE Daily Financial Markets Analysis & Forecasting online publication.