


Gold Completes Another Washout Rotation – Here We Go
Commodities / Gold & Silver 2020 Jul 02, 2020 - 01:44 PM GMTBy: Chris_Vermeulen

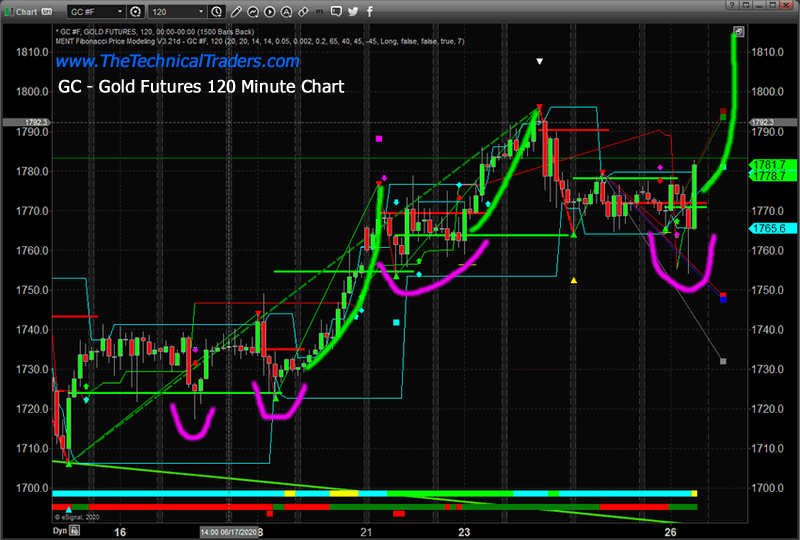
One of the most telling patterns in Gold over the past 6+ months has been the “washout low” price rotation pattern after establishing a momentum price base. It seems as though every time Gold completes one of the moderate-low price rotations, as we call it a “washout low rotation”, it sets up for a new momentum rally to a new momentum price base.
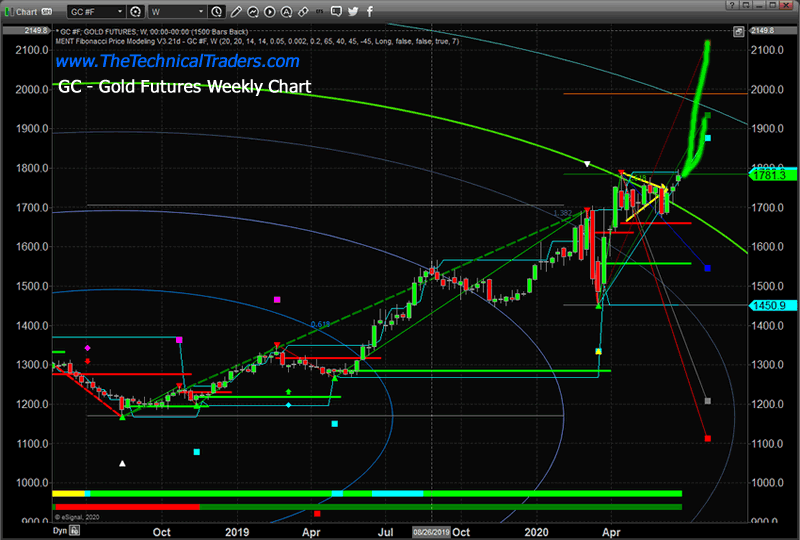
We believe July and August 2020 could prompt a series of these types of rotations as Gold attempts a move above $2100 or higher. Allow us to explain our thinking as we explore this price pattern a bit further.
The first thing we need to realize is that Gold is nearing the $1900 level as it continues to push higher. This is a very significant level for Gold because it would be very close to breaking the 2011 all-time high level near $1917.90. As gold creeps higher because of perceived risk factors in the global markets, once Gold price levels break above $1850, then the rally to levels above $1900 is almost certain to drive investors into the precious metals markets at a much faster pace. Psychologically, once Gold rallies above $1850 with the US stock market trading near all-time highs – something has to break. The disconnect between Gold (risk protection) and the valuation of equities (the stock market) are not aligned.
You may find these recent articles insightful:
June 25, 2020: US STOCK MARKET ENTERS PARABOLIC PHASE, PART II
June 20, 2020: ALL THAT GLITTERS WHEN THE WORLD JITTERS IS PROBABLY GOLD
June 17, 2020: FIBONACCI PRICEMODELING SUGGESTS MASSIVE RESISTANCE RANGE IN THE US MARKETS
GOING ALL THE WAY BACK TO 1973
If you understand how the US Fed and global central banks are pumped “ether” into the markets (in the form of capital and QE functions) in an effort to support the capital markets and financial sector, then you understand the current market environment is very unique. The only other time we’ve seen anything like this is in early 1976 through 1981 when the capital markets were suddenly awash in credit and precious metals rallied more than 700%. This was a period when global traders realized the risk factors in the markets while credit was expanding and the US stock market was just starting to recover from a deep -50% collapse (1973~1974).
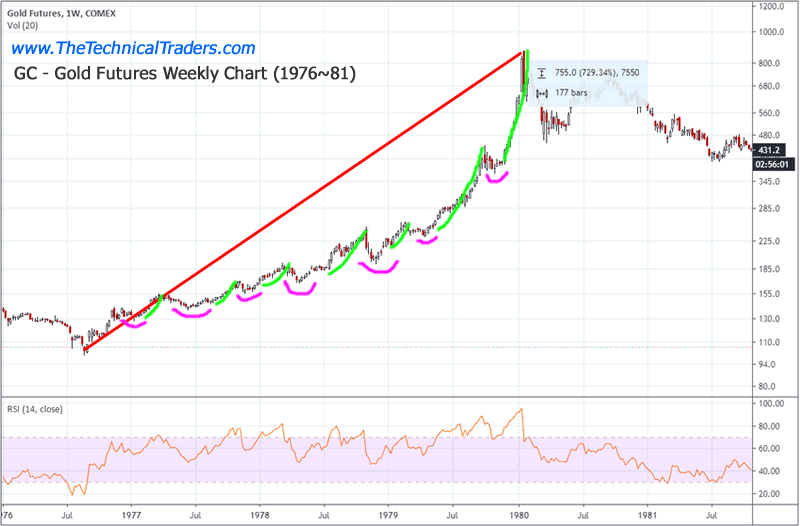
What happened in 1973 & 1974 was the US economy went from a booming stock market (+15% in 1972) and booming GDP (+7.2%) to a grinding halt with GDP clocking in a -2.1% and the DJIA collapsing over 45%. Additionally, inflation skyrocketed from 3.4% in 1972 to 12.3% in 1974. How does this compare to today’s markets?
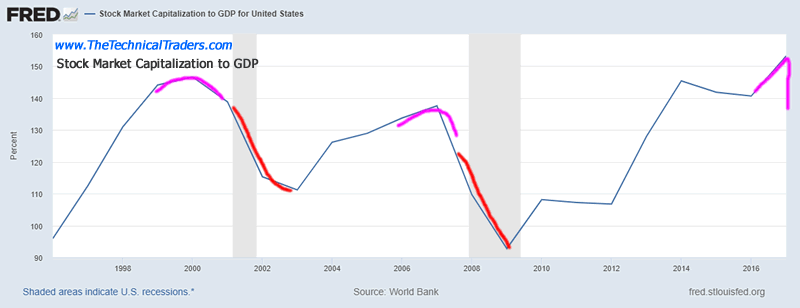
UNDERSTANDING STOCK MARKET VALUATIONS TO GDP LEVELS
Last year, 2019, the SPX rallied over 27% and US GDP levels were clocking in a 2~3%+ (expected). One measure we like to use in trying to make comparisons to the past is the stock market valuation level compared to GDP. Even though this St. Louis Federal Reserve Chart does not show data beyond 2017, just imagine what the peak level of this chart would look like for 2018, 2019, and early 2020. The current level was very likely well above 155 to 165+ before the February 2020 COVID-19 collapse.
These past correlations become very important for skilled technical traders because it helps us to understand the future potential price rally in Gold and Silver if a similar set of circumstances play out. If the COVID-19 pandemic collapses global GDP while the US Fed and other global central banks continue to pour capital into the credit/banking markets, resulting in an inflated global equities/stock market bubble, and the global stock markets enter an earnings/income contraction phase (much like 1973 & 1974) while inflation grows moderately, we could expect to see Gold continue to rally for the next 3 to 4+ years and attempt a 500% rally from current levels.
LEARNING TO SPOT THE WASHOUT LOW PATTERNS
Our researchers believe these “washout low” patterns are technically efficient buying opportunities for skilled technical traders. Believing that our research is accurate, these washout low patterns may continue to set up throughout the remainder of the rally in Gold and Silver – allowing skilled technical traders ample opportunity to catch big profits.
The next rally in Gold will likely target the $1850 level. Beyond that, the subsequent rally will likely target the $1950 to $2100 level – well beyond the previous all-time high level. We believe the Q2and Q3 data could be very reminiscent of 1973 through 1975 market action – with GDP contraction, earnings/revenue contraction, and a slower recovery process. If this is the case, then Gold will likely rally to levels far above $5000 as traders rush to safety.
This is really just the start of the potential rally in Gold and Silver. We’re trying to use historical examples to more clearly illustrate why it is so important for you to understand what is happening in the markets right now. We’ve been warning our clients and followers not to get sucked up into the current rally in the US stock market. We’ve been trying to scream at the top of our lungs that “risks are still excessive”. Today, the stock market is collapsing and we want to warn you that the dust is far from settled in our opinion.
Make sure you listen to Eric Sprott and Craig Hemke in this exciting talk about gold – CLICK TO LISTEN
Pay attention to our research and please protect your assets and family. The process of global recovery after the COVID-19 virus is likely to take more than 3 years or longer. There will be very big and incredible opportunities for skilled technical traders over that time. Learn how we can help you trade and find success in these markets
Get our Active ETF Swing Trade Signals or if you have any type of retirement account and are looking for signals when to own equities, bonds, or cash, be sure to become a member of my Passive Long-Term ETF Investing Signals which we are about to issue a new signal for subscribers.
Chris Vermeulen
www.TheTechnicalTraders.com
Chris Vermeulen has been involved in the markets since 1997 and is the founder of Technical Traders Ltd. He is an internationally recognized technical analyst, trader, and is the author of the book: 7 Steps to Win With Logic
Through years of research, trading and helping individual traders around the world. He learned that many traders have great trading ideas, but they lack one thing, they struggle to execute trades in a systematic way for consistent results. Chris helps educate traders with a three-hour video course that can change your trading results for the better.
His mission is to help his clients boost their trading performance while reducing market exposure and portfolio volatility.
He is a regular speaker on HoweStreet.com, and the FinancialSurvivorNetwork radio shows. Chris was also featured on the cover of AmalgaTrader Magazine, and contributes articles to several leading financial hubs like MarketOracle.co.uk
Disclaimer: Nothing in this report should be construed as a solicitation to buy or sell any securities mentioned. Technical Traders Ltd., its owners and the author of this report are not registered broker-dealers or financial advisors. Before investing in any securities, you should consult with your financial advisor and a registered broker-dealer. Never make an investment based solely on what you read in an online or printed report, including this report, especially if the investment involves a small, thinly-traded company that isn’t well known. Technical Traders Ltd. and the author of this report has been paid by Cardiff Energy Corp. In addition, the author owns shares of Cardiff Energy Corp. and would also benefit from volume and price appreciation of its stock. The information provided here within should not be construed as a financial analysis but rather as an advertisement. The author’s views and opinions regarding the companies featured in reports are his own views and are based on information that he has researched independently and has received, which the author assumes to be reliable. Technical Traders Ltd. and the author of this report do not guarantee the accuracy, completeness, or usefulness of any content of this report, nor its fitness for any particular purpose. Lastly, the author does not guarantee that any of the companies mentioned in the reports will perform as expected, and any comparisons made to other companies may not be valid or come into effect.
Chris Vermeulen Archive |
© 2005-2022 http://www.MarketOracle.co.uk - The Market Oracle is a FREE Daily Financial Markets Analysis & Forecasting online publication.