


Bitcoin Price Crash - You Will be Suprised What Happens Next
Currencies / Bitcoin Sep 07, 2020 - 03:34 PM GMTBy: Chris_Vermeulen

RESEARCH HIGHLIGHTS:
- Bitcoin collapsed near Triple Fib Amplitude Arcs – is this a sign of pending reversal for other assets?
- It is very likely that Bitcoin price levels will fall below the May through July levels, near $9k in an attempt to identify new support levels. The $8k level would be the next downside price target. Beyond that, possibly $7k or even $6k.
- Gold and Silver will move lower before going higher as a potential price collapse in Bitcoin suggests general market fear is hitting all global assets.
- As other assets decline in valuation levels, the US Dollar will likely be viewed as the strongest currency to own and rise.
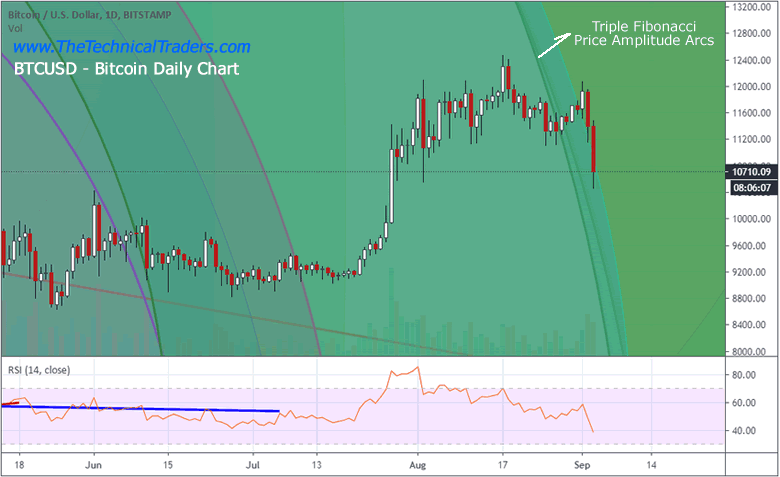
Many of you are familiar with my team’s advanced study of Fibonacci Price Theory and our use of our proprietary Fibonacci Price Amplitude Arc indicators. This technical analysis theory is a combination of Nikola Tesla’s Mechanical Resonance theory and traditional Fibonacci Price Theory. We believe the innate frequency of price action (once found), can be used to identify future critical inflection points in price. In this case with Bitcoin, three unique Fibonacci Price Amplitude Arcs aligned within 5 days to present a very real price inflection point. The recent collapse in the price of Bitcoin may be inherently related to the frequency of price from past peaks and troughs using our advanced Fibonacci Price Theory.
We found it interesting that Bitcoin prices stayed below $10k through most of June and July, when other Fibonacci Price Amplitude Arcs crossed price, then began to move higher after the last Price Amplitude Arc completed near July 20, 2020. After that Fibonacci Arc completed, the only Fibonacci Price Amplitude Arcs present in the future were the Triple Fibonacci Arcs shown on this Daily Bitcoin chart (below).
Our team also believes that once Bitcoin cleared the previous Fibonacci Arcs, a bit of a “reprieve” took place in price where a moderate upside price rally too place. As we neared the Triple Fibonacci Arcs, price activity muted and reversed. Could it be that price reacts to frequency levels we are not seeing on the charts?
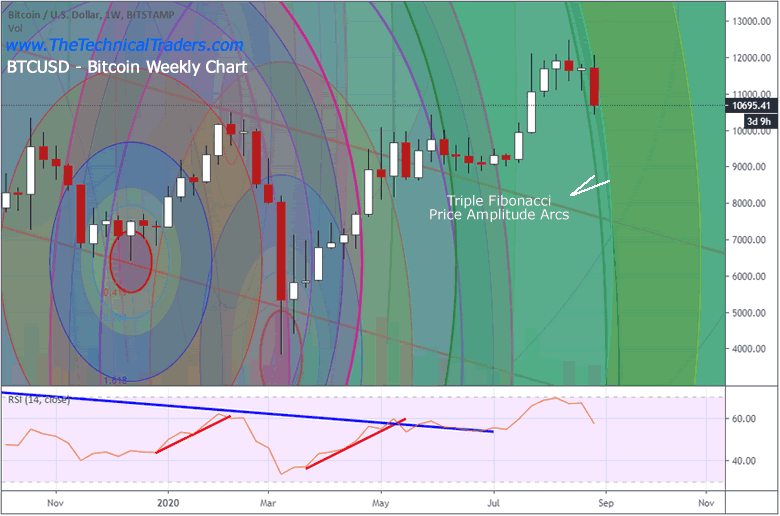
The Weekly BitCoin chart, below, highlights many of the origination points (peaks and troughs) of the Fibonacci Price Amplitude Arcs. We anchor them to price peaks or troughs as a way to use and study them, measuring critical price waves (up or down) using Eclipse drawing tools, then drag them and anchor them to current or past peaks or troughs. Then we study the levels to determine if the frequency of price validity is accurate or not. If we believe we have drawn a Fibonacci Price Amplitude Arc that is valid, we’ll keep in on the chart for future reference.
We believe this current Triple Fibonacci Arc pattern may be present in other symbols given how the US stock markets have reversed recently. It may be that these critical price inflection points operate across major indexes like tides in the ocean work across multiple ports and harbors. When a big or critical Fibonacci Price Amplitude Arc hits, we believe it results in a broad market reaction.
If this breakdown in Bitcoin Continues, the $8k level would be the next downside price target. Beyond that, possibly $7k and maybe as low as $6k. We will have to see how Bitcoin reacts to this Triple Fibonacci Price Amplitude Arc and how deep price corrects at this time. It is very likely that Bitcoin price levels will fall below the May through July levels, near $9k in an attempt to identify new support levels.
We also believe Gold and Silver will move lower as a price collapse in Bitcoin suggests general market fear it hitting all global assets. The US Dollar may attempt to form support as well because of this move. As other assets decline in valuation levels, some primary currency will likely be viewed as the strongest alternative asset – this will likely be the US Dollar. Eventually, after what we believe could be a moderate downtrend in Gold and Silver, precious metals will begin to move dramatically higher as foreign currency and Bitcoin prices continue to fall. Capital will always seek out the best, least risky, investment solutions at times of chaos and risk. If Bitcoin becomes highly volatile and continues to fall, then alternate assets present very real opportunities.
Isn’t it time you learned how I can help you better understand technical analysis as well as find and execute better trades? If you look back at past research, you will see that my incredible team and our proprietary technical analysis tools have shown you what to from the markets in the future. Do you want to learn how to profit from these expected huge moves? If so, sign up for my Active ETF Swing Trade Signals today!
If you have a buy-and-hold or retirement account and are looking for long-term technical signals for when to buy and sell equities, bonds, precious metals, or sit in cash then be sure to subscribe to my Passive Long-Term ETF Investing Signals to stay ahead of the market!
Chris Vermeulen
www.TheTechnicalTraders.com
Chris Vermeulen has been involved in the markets since 1997 and is the founder of Technical Traders Ltd. He is an internationally recognized technical analyst, trader, and is the author of the book: 7 Steps to Win With Logic
Through years of research, trading and helping individual traders around the world. He learned that many traders have great trading ideas, but they lack one thing, they struggle to execute trades in a systematic way for consistent results. Chris helps educate traders with a three-hour video course that can change your trading results for the better.
His mission is to help his clients boost their trading performance while reducing market exposure and portfolio volatility.
He is a regular speaker on HoweStreet.com, and the FinancialSurvivorNetwork radio shows. Chris was also featured on the cover of AmalgaTrader Magazine, and contributes articles to several leading financial hubs like MarketOracle.co.uk
Disclaimer: Nothing in this report should be construed as a solicitation to buy or sell any securities mentioned. Technical Traders Ltd., its owners and the author of this report are not registered broker-dealers or financial advisors. Before investing in any securities, you should consult with your financial advisor and a registered broker-dealer. Never make an investment based solely on what you read in an online or printed report, including this report, especially if the investment involves a small, thinly-traded company that isn’t well known. Technical Traders Ltd. and the author of this report has been paid by Cardiff Energy Corp. In addition, the author owns shares of Cardiff Energy Corp. and would also benefit from volume and price appreciation of its stock. The information provided here within should not be construed as a financial analysis but rather as an advertisement. The author’s views and opinions regarding the companies featured in reports are his own views and are based on information that he has researched independently and has received, which the author assumes to be reliable. Technical Traders Ltd. and the author of this report do not guarantee the accuracy, completeness, or usefulness of any content of this report, nor its fitness for any particular purpose. Lastly, the author does not guarantee that any of the companies mentioned in the reports will perform as expected, and any comparisons made to other companies may not be valid or come into effect.
Chris Vermeulen Archive |
© 2005-2022 http://www.MarketOracle.co.uk - The Market Oracle is a FREE Daily Financial Markets Analysis & Forecasting online publication.