


Commodity Bull Market Cycle Starts with Euro and Dollar Trend Changes
Stock-Markets / Financial Markets 2020 Oct 19, 2020 - 12:47 PM GMTBy: Chris_Vermeulen

In this report, I would like to show you how currency values play an important role in the price of commodities like gold and silver. The analysis here is all about the EUR/USD currency pair to give you an idea of how they can help time and predict future price movement in metals. This is just one commodity pair out of several which provide similar insight and the more pairs that confirm, the stronger our signal and market timing will be.
Commodity bull eras do not need a strong Euro… but it definitely helps if the US Dollar weakens, as anything denominated in it like gold, silver, and oil will have a higher nominal value.
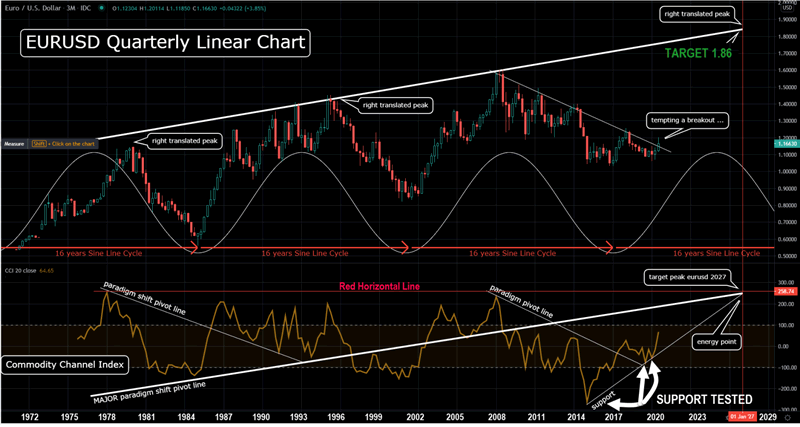
There are a few interesting points to look at in the EUR/USD chart presented below. You will have keep scrolling down to look at the chart to see a visual of each technical analysis point I am sharing with you. The first thing you may notice is that the 16-year cycles for this forex currency pair are pretty harmonious. Usually, a single cycle like the one shown on this chart does not fit or overlay on an instrument this well because there are almost always more than one cycle at work skewing things, however, the cycle in this chart just happen to be very clean.
When you know which cycle is the strongest of them all, it adds value to the probability of where and when the next major turning point will be for that asset. In this currency pair, the 16-year cycle is the strongest. In fact, I spoke with Rick Rule a few weeks ago and we touched on these longer-term commodity cycles and what we both feel is unfolding now in the markets. He had some very interesting analysis and he blew my mind when he explained how Sprott gold miners ETFs are constructed. If you don’t know what I am talking about this is a MUST WATCH!
Ok, back to the chart below! Currently, the EUR/USD is breaking out to the upside on the quarterly linear chart, but not yet on the logarithmic chart. This is giving us signals that a paradigm shift is in progress. A new cycle where the US Dollar will weaken vs Euro. Those looking at DXY for the US Dollar proxy will notice Euro is a big part of that index.
When looking at a resistance trend line based on quarterly closes, we understand that any points on that line will offer substantial resistance when hit. When price reaches the level, we call it a ‘measured move’, and price could reverse lower once hit.
Another good indicator to get more clues on the strength or weakness of actual price action is the CCI (Commodity Channel Index). This is the indicator located at the bottom of the chart. You can chart this indicator as you would the actual price action with trendlines. A major, multi-decade, paradigm shift pivot line can be drawn. Since we are below it, that is now our “pivot line defined target”.
Further, the high-water marks for the CCI where the EURUSD pair put in a significant top (red horizontal line). That is another target where we can estimate probabilities of setting in an important top.
One more piece of the puzzle is the current supporting white trend line which has already been tested 3 times. We now have a trend angle of ascent defined by this indicator and its analysis.
All three of those elements converge to an “energy point”. We now have a target in price AND in time, Win-Win! Target is 1.86 (which can overshoot on smaller time-frames) for early 2027.
When you add this to other currency cycle charts and the gold chart, as an example, the evidence keeps piling up. We are in an embryonic commodity bull era unfolding before our eyes. There will be noise on smaller time frames, but the higher time frames (monthly and higher) bear the most weight for the determination of a trend.
If you want to see what is about to happen that will be a life-changing opportunity for you, join me on Oct 14th at 6pm ET for my 55-minute seminar on the most active supercycles for the US stock market, including Gold, Silver, and Miners. You can also catch great political speakers at this event discussing the presidential election, which ties into my election year cycle analysis as well. Signup and attend for this Wealth365 event for FREE here.

Concluding Thoughts:
In short, you can see how one chart, provides a plethora of evidence just waiting to be observed, giving you confidence to make smart trading and investing decisions and helping you “sleep well at night” knowing about new upcoming multi-year trends.
If you would like to learn more about cycles, investing, or trading signals for the major asset classes visit my research and trading newsletter.
Chris Vermeulen
www.TheTechnicalTraders.com
Chris Vermeulen has been involved in the markets since 1997 and is the founder of Technical Traders Ltd. He is an internationally recognized technical analyst, trader, and is the author of the book: 7 Steps to Win With Logic
Through years of research, trading and helping individual traders around the world. He learned that many traders have great trading ideas, but they lack one thing, they struggle to execute trades in a systematic way for consistent results. Chris helps educate traders with a three-hour video course that can change your trading results for the better.
His mission is to help his clients boost their trading performance while reducing market exposure and portfolio volatility.
He is a regular speaker on HoweStreet.com, and the FinancialSurvivorNetwork radio shows. Chris was also featured on the cover of AmalgaTrader Magazine, and contributes articles to several leading financial hubs like MarketOracle.co.uk
Disclaimer: Nothing in this report should be construed as a solicitation to buy or sell any securities mentioned. Technical Traders Ltd., its owners and the author of this report are not registered broker-dealers or financial advisors. Before investing in any securities, you should consult with your financial advisor and a registered broker-dealer. Never make an investment based solely on what you read in an online or printed report, including this report, especially if the investment involves a small, thinly-traded company that isn’t well known. Technical Traders Ltd. and the author of this report has been paid by Cardiff Energy Corp. In addition, the author owns shares of Cardiff Energy Corp. and would also benefit from volume and price appreciation of its stock. The information provided here within should not be construed as a financial analysis but rather as an advertisement. The author’s views and opinions regarding the companies featured in reports are his own views and are based on information that he has researched independently and has received, which the author assumes to be reliable. Technical Traders Ltd. and the author of this report do not guarantee the accuracy, completeness, or usefulness of any content of this report, nor its fitness for any particular purpose. Lastly, the author does not guarantee that any of the companies mentioned in the reports will perform as expected, and any comparisons made to other companies may not be valid or come into effect.
Chris Vermeulen Archive |
© 2005-2022 http://www.MarketOracle.co.uk - The Market Oracle is a FREE Daily Financial Markets Analysis & Forecasting online publication.