


Stock Market Great ADP Figures But Things Can Still Turn Nasty
Stock-Markets / Stock Market 2021 Mar 09, 2021 - 02:15 PM GMTBy: Submissions

Powell gave a wait-and-see answer to my yesterday‘s rhetorical question about the bears just starting out, indeed. The S&P 500 plunged, breaking far outside the Bollinger Bands confines, illustrating the extraordinary nature of the move. Rebound would be perfectly natural here (and we‘re getting one as we speak) – but will it be more than a dead cat bounce?
Stocks partially recovered from last Friday‘s intraday plunge, and good news about the stimulus clearing House followed after the market close – stock bulls took the opportunity, and Monday‘s session gave signs that the worst is over. Tuesday‘s move partially negated that, but even after Wednesday, the short-term case was undecided (even as tech kept acting relatively weak).
Yesterday‘s session though gives the short-term advantage to the bears, and that‘s because of the weak performance I see in other stock market indices and bonds. The Russell 2000 got under pressure, negating what by yesterday still looked like a shallow correction there. So did the emerging markets and their bonds. More downside can materialize either suddenly or slowly over the coming say 1-2 weeks. It depends on the tech and its heavyweight names, where these find support.
Corporate credit markets aren‘t weakening as dramatically though – as you‘ll see illustrated later on, both high yield corporate bonds and the HYG:SHY ratio are holding up much better than stocks. While that‘s bullish, the S&P 500 apparently hasn‘t yet learned to live with higher rates – let alone considerably higher ones.
The key element playing the markets now, is the Fed‘s approach to inflation, rising long-term Treasuries in the face of central bank inaction and inflation denialism, which translates into the dollar taking the turn higher courtesy of the stresses induced across many asset classes.
I asked yesterday:
(...) How far is the Fed announcing yield curve control, or at least a twist program? Markets crave more intervention, and those calling for rate hikes to materialize soon, are landing with egg on their faces – mark my words, the Fed is going to stay accommodative longer than generally anticipated – have we learned nothing from the Yellen Fed?
The ostrich pose on inflation isn‘t helping – it‘s sending Treasuries down, turning much of the rest red. Does the Fed want to see the market forcing some kind of answer / action the way it did in Dec 2018? The Fed is risking such a development now, this time through inaction, and not thanks to monetary tightening as back then.
While some argue that inflation just brings a Fed rate hike closer, I really doubt that this option is treated seriously inside the Eccles building. It would be the right choice if you were serious about fighting inflation before it takes root – but in whose interest is that? Just look at the transitory statements, Fed official beliefs that to see it hit even 3% would be extraordinary, and you understand that their models understating it considerably in the first place, aren‘t even sending them the correct, signals.
I see it as more probable that they would just try to suppress its symptoms, and succumb to the markets even more vocally demanding some action, by going the twist route. In effect, they would be then fighting the war on two fronts, as I explained in the middle of Feb already.
Food inflation running hot, commodities on fire, and gold is going nowhere still. The bears are vocal, and I‘ve laid down a realistic game plan yesterday, discussing the gold support levels and perspectives. If you‘re disappointed that gold isn‘t doing as well as commodities, consider the mid-Feb described cascading inflation process as it devours more and more of the financial landscape – we still have a weak job market that doesn‘t contribute to the inflationary pressures, relegating the true, undeniable inflation to the 2022-3 timeframe.
Let‘s keep the big picture – gold is in a secular bull market that started in 2018 (if not in late 2015), and what we‘re seeing since the Aug 2020 top, is the soft patch I called. The name of the game now, is where the downside stops – I am not capitulating to (hundreds dollars) lower numbers below $1,650 on a sustainable basis. The new precious metals upleg is a question of time even though the waiting is getting longer than comfortable for many, including myself.
Let‘s move right into the charts (all courtesy of www.stockcharts.com).
S&P 500 Outlook and Its Internals
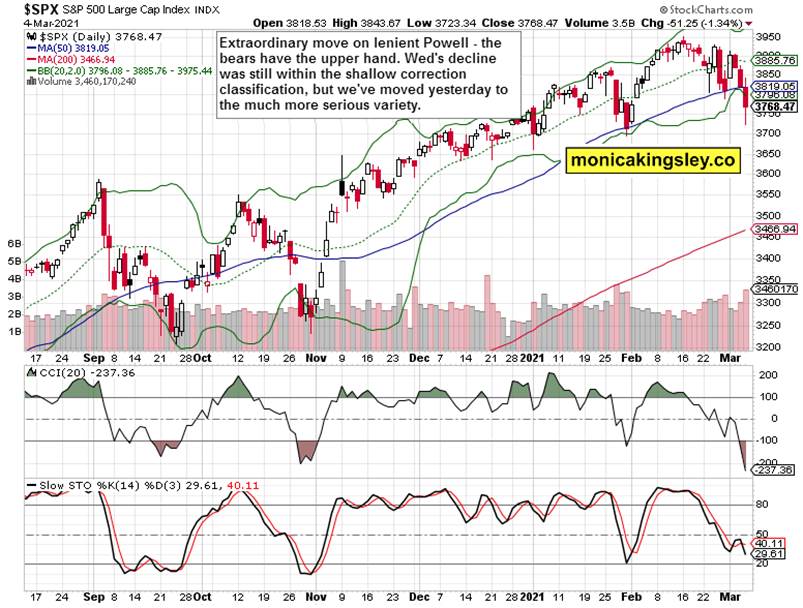
Reasonably heavy volume with most of yesterday‘s candle, pushing vigorously to start a new downtrend. Given yesterday‘s move, some kind of retracement is likely today as a minimum, but the bears have the upper hand now.
Credit Markets
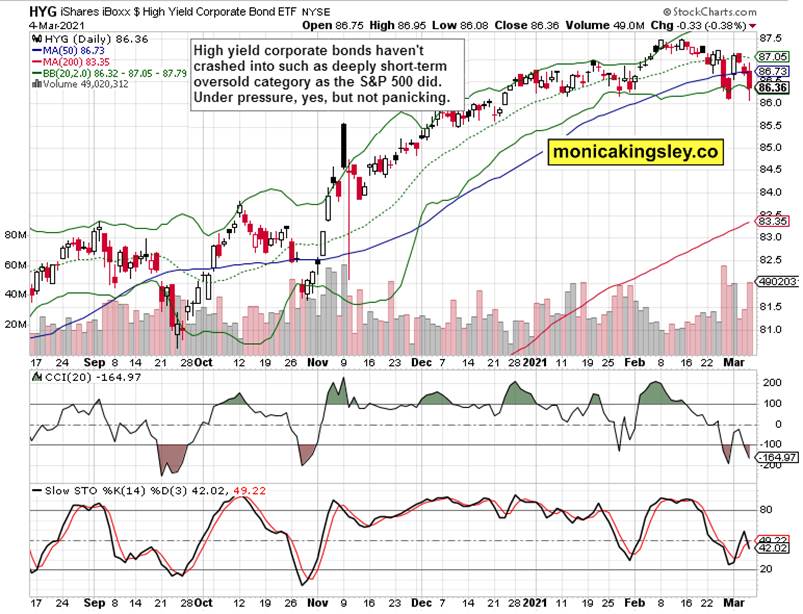
High yield corporate bonds (HYG ETF) haven‘t declined below last week‘s lows, and are still at bullish divergence readings. Will they keep above these? Doing so is essential for the still unfolding S&P 500 correction.
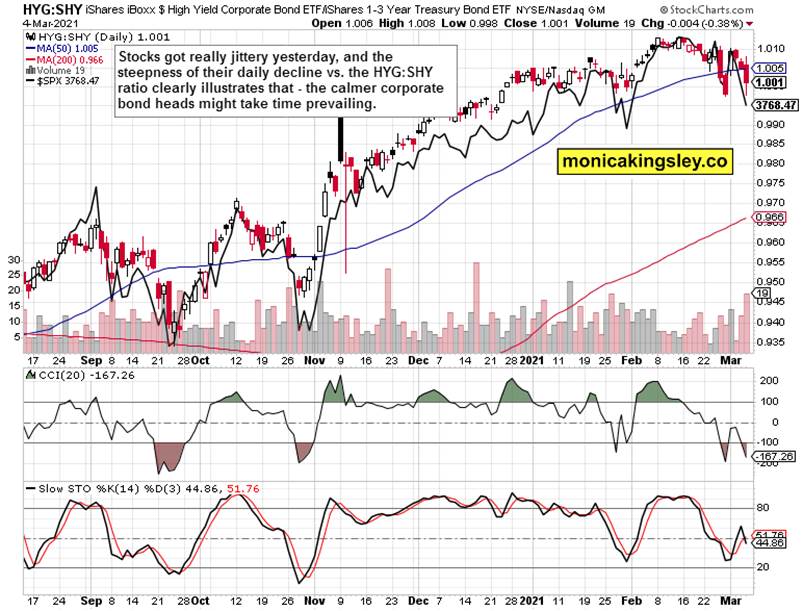
High yield corporate bonds to short-dated Treasuries (HYG:SHY) aren‘t as panicky as stocks here, which is more than mildly optimistic.
Put/Call Ratio and Volatility
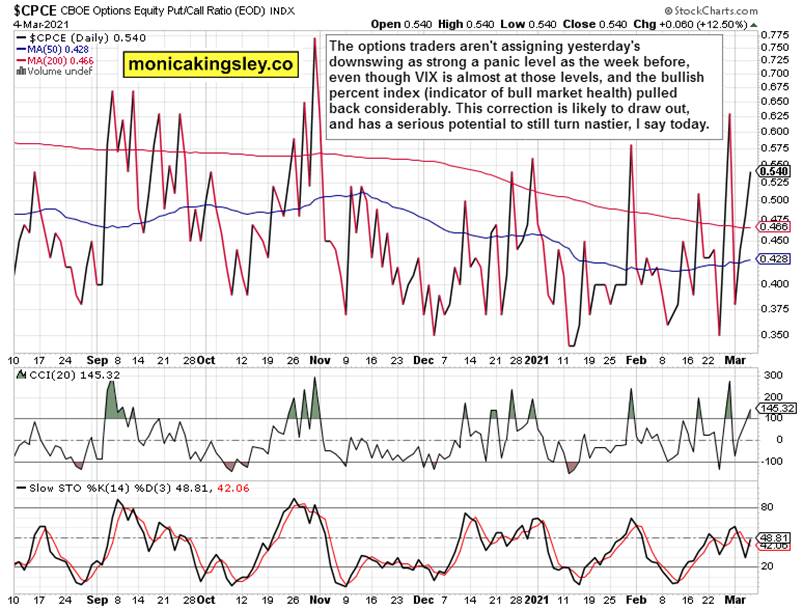
The put/call ratio is well below the Feb or Jan highs, while the volatility index is much higher relatively to these. While that‘s an opportunity for even more panic, volatily would quickly die down if today‘s S&P 500 upswing sticks. Then, it would be time to evaluate the changes in posture. Either way, this correction appears to have longer to run still.
Technology
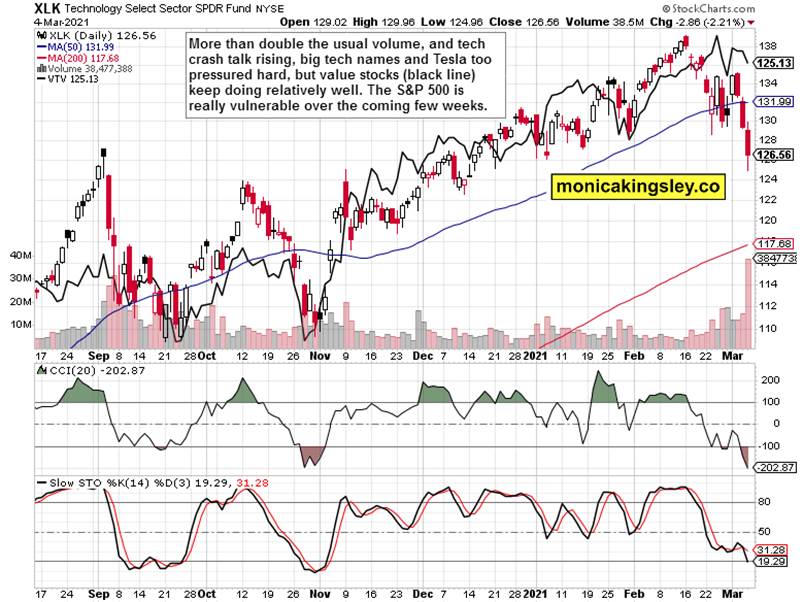
Technology (XLK ETF) compared to the value stocks (VTV ETF) shows where the engine of decline is – and it‘s starting to have an effect on value, high beta plays. Not until tech stabilizes, can the correction be called as really close to over – just check how the equal weighted S&P 500 (RSP ETF) suffers right now.
Gold, Silver and Miners
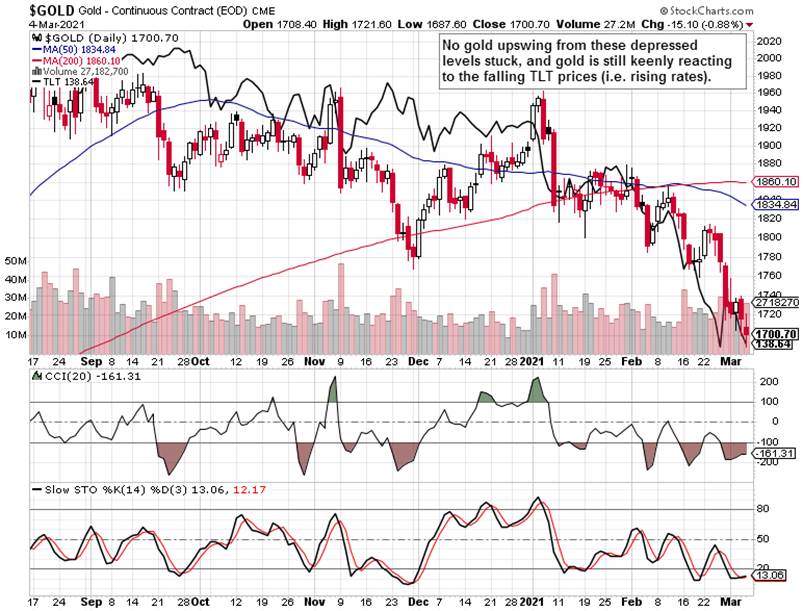
Another bite into the volume profile support zone, and the gold upswing isn‘t here still. Another missed daily opportunity to rebound. The yellow metal is still in a precarious position until it shakes off the rising (nominal, not real) rates albatross.
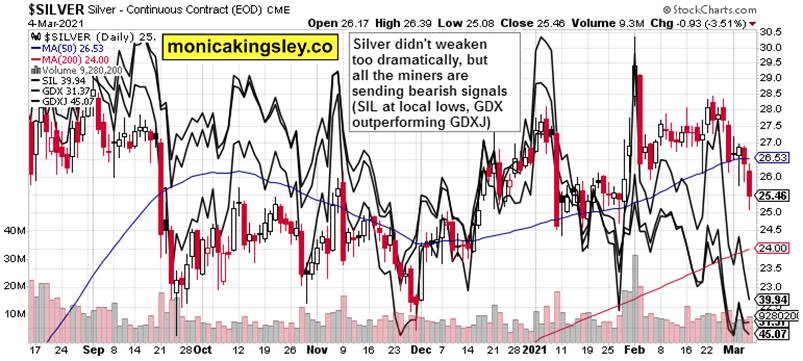
Silver is in a technically stronger position, but signs of deterioration are creeping here too. It‘s painfully obvious when the miners are examined – the silver ones are leading to the downside, and the gold ones, well seniors outperforming juniors isn‘t a sign of strength really. The sky isn‘t definitely clear here.
Summary
Stock bulls have to once again try to repair the damage, and their success depends on the tech the most. The S&P 500 internals are slightly deteriorating, but the credit market performance remains more solid. New highs remain a question of time (and the stimulus carrot).
Gold remains acting weak around the lower border of its support zone, and silver is joining in the deterioration, not to mention the mining indices. The yellow metal is though short-term holding up rather well, when the TLT and USDX pressures are considered.
Thank you for having read today‘s free analysis, which is available in full at my homesite. There, you can subscribe to the free Monica‘s Insider Club, which features real-time trade calls and intraday updates for both Stock Trading Signals and Gold Trading Signals.
Thank you,
Monica Kingsley
Stock Trading Signals
Gold Trading Signals
www.monicakingsley.co
mk@monicakingsley.co
* * * * *
All essays, research and information represent analyses and opinions of Monica Kingsley that are based on available and latest data. Despite careful research and best efforts, it may prove wrong and be subject to change with or without notice. Monica Kingsley does not guarantee the accuracy or thoroughness of the data or information reported. Her content serves educational purposes and should not be relied upon as advice or construed as providing recommendations of any kind. Futures, stocks and options are financial instruments not suitable for every investor. Please be advised that you invest at your own risk. Monica Kingsley is not a Registered Securities Advisor. By reading her writings, you agree that she will not be held responsible or liable for any decisions you make. Investing, trading and speculating in financial markets may involve high risk of loss. Monica Kingsley may have a short or long position in any securities, including those mentioned in her writings, and may make additional purchases and/or sales of those securities without notice.
© 2005-2022 http://www.MarketOracle.co.uk - The Market Oracle is a FREE Daily Financial Markets Analysis & Forecasting online publication.