


Stock Market Short Lived Rallies Suggest Investors Want Out
Stock-Markets / US Stock Markets Oct 19, 2008 - 07:58 AM GMTBy: Mike_Burk

 The good news is: New lows have fallen off sharply.
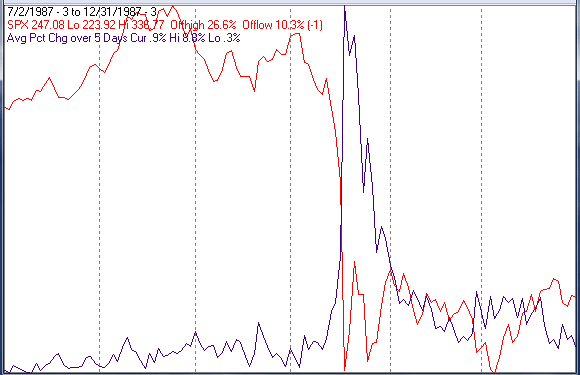
Short Term - The preludes to the crash of 87 and the crash of 08 were very different, but the price patterns that followed have, so far, been similar. The percentage of issues hitting new lows in the crash of 87 set a record that held until a week ago. The 5 day average of the absolute value of the percentage change of the S&P 500 (SPX) set a record in 87 that still holds.
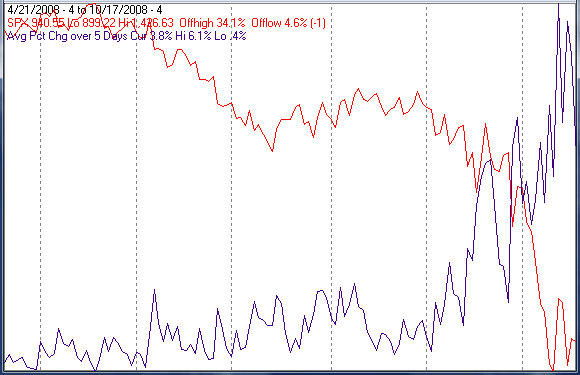
The chart below covers the past 6 months showing the SPX in red and an indicator showing the absolute value of the daily percentage change of the SPX over the previous 5 trading days. Dashed vertical lines have been drawn on the 1st trading day of each month. The indicator hit a high of 6.1% last Monday.
The next chart shows the same index and indicator during and after the 87 crash. Notice the similar patterns of the index following the crash low and the low of a week ago shown above.
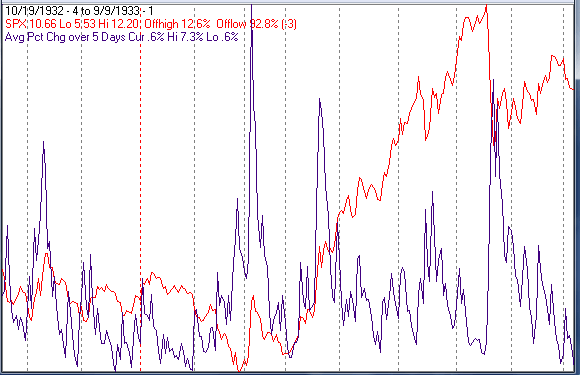
The next chart shows the second highest 5 day period of volatility (7.3%) for the SPX recorded in March 1933 when the SPX moved UP 16% in one day.
Intermediate term
I use a 10% trend (19 day EMA) of new lows as an indicator of that data set.
The value of the NYSE new low indicator hit a high of 304 in 87 or about 15% of issues traded. The value of the indicator hit 1129 a week ago or about 34% of issues traded.
The value of the NASDAQ new low indicator hit a high of 653 in 87 or about 17% of issues traded. The value of the indicator hit 555 a week ago or about 19% of issues traded.
The spectacularly high percentage of new lows on the NYSE may have a lot to do with the high percentage of fixed income related issues traded on the NYSE.
I have mentioned before the problem of contamination of NYSE breadth data with fixed income issues in recent years. Fixed income issues accumulate dividends incrementally every day giving them a very strong upward bias.
Measured with NASDAQ breadth data the crash of 08 is not much worse than the crash of 87. Measured with NYSE breadth data the crash of 08 looks a lot worse than the crash of 87.
1994 was the last time the equity markets were brought down by the fixed income markets. In 1994 the blue chips topped on about February 1 while the secondaries topped in late March then quickly caught up with the blue chips to the down side. This year the secondaries held up better than the blue chips until about a month ago and have now caught up on the down side.
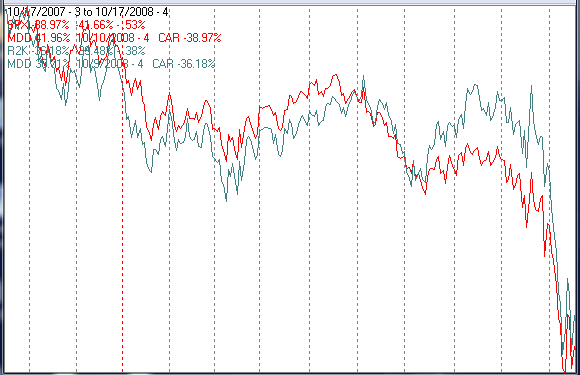
The chart below covers the past year showing the SPX in red and the Russell 2000 (R2K) in green. The indices have been plotted on log scales so you can see their performance relative to each other. The R2K was stronger than the SPX until about 3 weeks ago.
The next chart shows the SPX and R2K on log scales for CY 94.
The R2K peaked in Late March about 6 weeks after the SPX peaked. The R2K low in early December marked the low for the cycle.
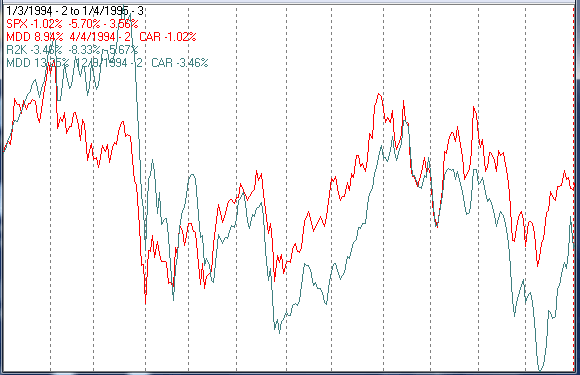
In early 1994 the Fed raised interest rates catching many fixed income managers by surprise. It was billed as the worst fixed income crisis in decades and one explanation offered was equities had to be sold to cover fixed income losses. Some brokerage companies went out of business and the malaise lasted nearly a year.
Seasonality
Next week includes the 5 trading days prior to the 4th Friday of October during the 4th year of the Presidential Cycle.
The tables show the daily return on a percentage basis for the 5 trading days prior to the 4th Friday of October during the 4th year of the Presidential Cycle. OTC data covers the period from 1963 - 2007 and SPX data from 1953 - 2007. Prior to 1953 the market traded 6 days a week so that data has been ignored. There are summaries for both the 4th year of the Presidential Cycle and all years combined.
Returns for the week have been negative by every measure over all periods.
Report for the week before the 4th Friday of October.
The number following the year is the position in the presidential cycle.
Daily returns from Monday through the 4th Friday.
| OTC Presidential Year 4 | ||||||
| Year | Mon | Tue | Wed | Thur | Fri | Totals |
| 1964-4 | -0.43% | 0.25% | -0.18% | -0.23% | 0.44% | -0.16% |
| 1968-4 | 0.71% | -0.65% | 0.00% | -0.63% | -0.76% | -1.33% |
| 1972-4 | 0.52% | 0.19% | -0.02% | 0.37% | 0.12% | 1.19% |
| 1976-4 | 0.45% | -0.01% | 0.20% | -0.16% | -0.26% | 0.23% |
| 1980-4 | -0.05% | -0.35% | 0.73% | -1.06% | 0.18% | -0.53% |
| 1984-4 | -0.25% | 0.02% | 0.09% | -0.73% | -0.65% | -1.52% |
| Avg | 0.28% | -0.16% | 0.25% | -0.44% | -0.27% | -0.39% |
| 1988-4 | -0.35% | -0.29% | -0.24% | -0.89% | 0.27% | -1.50% |
| 1992-4 | 1.38% | 0.34% | 0.75% | -0.01% | 0.03% | 2.50% |
| 1996-4 | -0.49% | -1.33% | 0.65% | -0.07% | -0.36% | -1.60% |
| 2000-4 | -0.41% | -1.41% | -5.56% | 1.32% | 0.19% | -5.88% |
| 2004-4 | 1.31% | -0.70% | 0.52% | 1.07% | -1.97% | 0.23% |
| Avg | 0.29% | -0.68% | -0.78% | 0.28% | -0.37% | -1.25% |
| OTC summary for Presidential Year 4 1964 - 2004 | ||||||
| Avg | 0.22% | -0.36% | -0.31% | -0.09% | -0.25% | -0.76% |
| Win% | 45% | 36% | 60% | 27% | 55% | 36% |
| OTC summary for all years 1963 - 2007 | ||||||
| Avg | -0.10% | -0.37% | 0.27% | -0.17% | -0.07% | -0.45% |
| Win% | 44% | 40% | 59% | 47% | 53% | 49% |
| SPX Presidential Year 4 | ||||||
| Year | Mon | Tue | Wed | Thur | Fri | Totals |
| 1956-4 | -0.02% | -0.24% | -0.41% | -0.17% | 0.92% | 0.07% |
| 1960-4 | -1.16% | -0.76% | 1.43% | 1.07% | -0.39% | 0.20% |
| 1964-4 | 0.12% | 0.29% | -0.09% | -0.19% | 0.24% | 0.37% |
| 1968-4 | 0.16% | -0.40% | 0.00% | -0.70% | 0.35% | -0.59% |
| 1972-4 | 1.02% | 0.42% | -0.08% | 0.24% | -0.33% | 1.26% |
| 1976-4 | 0.61% | -0.02% | 0.29% | -0.95% | -0.80% | -0.88% |
| 1980-4 | 0.83% | -0.58% | 0.06% | -1.81% | 0.25% | -1.26% |
| 1984-4 | -0.36% | -0.16% | 0.07% | -0.53% | -0.61% | -1.60% |
| Avg | 0.45% | -0.15% | 0.08% | -0.75% | -0.23% | -0.61% |
| 1988-4 | -0.49% | 0.04% | -0.35% | -1.46% | 0.45% | -1.81% |
| 1992-4 | 0.79% | 0.12% | 0.05% | -0.19% | -0.19% | 0.58% |
| 1996-4 | -0.14% | -0.46% | 0.10% | -0.70% | -0.19% | -1.40% |
| 2000-4 | -0.08% | 0.17% | -2.38% | -0.03% | 1.11% | -1.21% |
| 2004-4 | 0.53% | -0.97% | 0.04% | 0.26% | -0.97% | -1.12% |
| Avg | 0.12% | -0.22% | -0.51% | -0.42% | 0.04% | -0.99% |
| SPX summary for Presidential Year 4 1956 - 2004 | ||||||
| Avg | 0.14% | -0.20% | -0.11% | -0.40% | -0.01% | -0.57% |
| Win% | 54% | 38% | 58% | 23% | 46% | 38% |
| SPX summary for all years 1953 - 2007 | ||||||
| Avg | -0.30% | 0.00% | 0.32% | -0.31% | 0.01% | -0.28% |
| Win% | 53% | 46% | 61% | 33% | 46% | 45% |
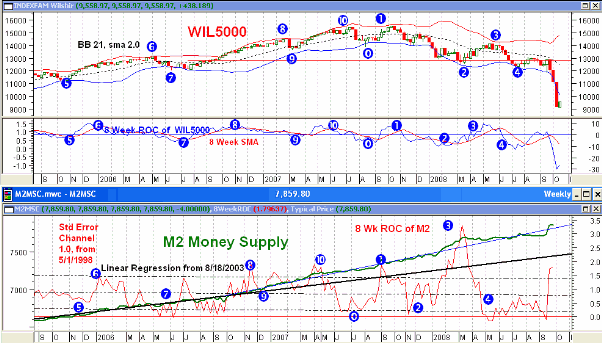
Money supply (M2)
The chart below was provided by Gordon Harms.
M2 growth leveled off after its big jump.

Conclusion
Short lived rallies and late day sell offs suggest there are still a lot of people looking to get out of equities.
I expect the major indices to be Lower on Friday October 24 than they were on Friday October 17.
Thank you,
By Mike Burk
To subscribe to this report : http://alphaim.net/signup.html
Gordon Harms produces a Power Point for our local timing group. You can get a copy of that at: http://www.stockmarket-ta.com/ .
Disclaimer: Mike Burk is an employee and principal of Alpha Investment Management (Alpha) a registered investment advisor. Charts and figures presented herein are believed to be reliable but we cannot attest to their accuracy. Recent (last 10-15 yrs.) data has been supplied by CSI (csidata.com), FastTrack (fasttrack.net), Quotes Plus (qp2.com) and the Wall Street Journal (wsj.com). Historical data is from Barron's and ISI price books. The views expressed are provided for information purposes only and should not be construed in any way as investment advice. Furthermore, the opinions expressed may change without notice.
Mike Burk Archive |
© 2005-2022 http://www.MarketOracle.co.uk - The Market Oracle is a FREE Daily Financial Markets Analysis & Forecasting online publication.