


Stock Market Volatility Crash Course (VIX vs VVIX) – Learn How to Profit From Volatility
Stock-Markets / Volatility Jun 07, 2021 - 03:56 PM GMTBy: Chris_Vermeulen

Volatility is the most common way to measure risk in the financial markets. While there are a plethora of methods, calculations, and derivatives to calculate volatility, they are all trying to accomplish the same goal: what is the price of a security going to do in the future? Without a crystal ball, there’s no perfect answer, but let’s go through a few common ways that we can estimate future volatility.
Let’s Talk Volatility
Generally speaking, there are two types of volatility that traders and investors use in an effort to understand risk – historical volatility and implied volatility. Each of these can be used in different ways for different types of trades. Today we’re going to go through the basics of implied volatility, starting with the VIX. First proposed as the Sigma Index in 1987, the VIX got its start in 1993 when the CBOE reported implied volatility in real time using at-the-money options data from the S&P 100. While updates have been made to the VIX over time, it’s used as a “fear gauge” or a measure of the market’s expectations of future price action. As the VIX increases, the market expects more risk ahead.
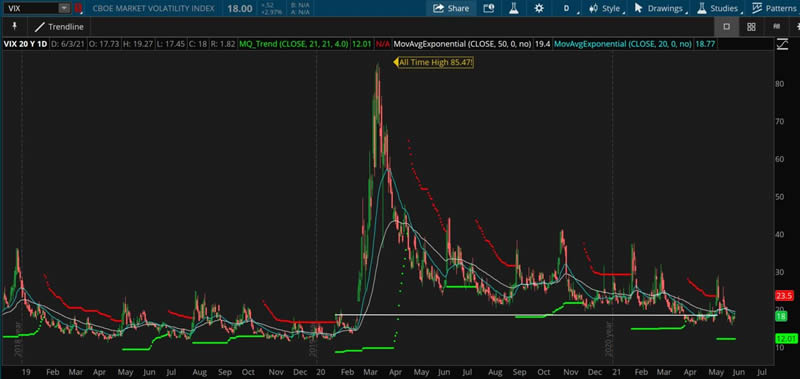
Take a look at the most recent recession in 2020 – where we saw the VIX climb as high as 85. At that price, the market is expecting extreme risk. Ultimately, the VIX is the industry standard to help traders and investors have a standardized view of market risk through implied volatility.
The VIX is useful because it can give us a hint at what the market is expecting since it is an example of implied volatility. Typically, IV is derived using an options pricing model, such as the Black–Scholes. Using these models, the theoretical value of an option can help guide us to the measurement of implied volatility at a particular point in time.
Traders and investors can use IV to find attractive options trades to hedge, enter or exit a position, or to speculate on a future outcome in the market.
Historical Volatility
While the VIX is a measure of implied volatility, there are many historical measures of volatility that can be useful. One common example is the beta coefficient. This is a historical calculation measured by taking the returns associated with a security and comparing the price action of the market over the same time period. A security with a beta less than 1 implies that the security is theoretically less volatile than the market as a whole. A security with a beta greater than 1 would be more volatile than the market.
For those that want to have a full picture of the risk of a security, the beta coefficient can help separate market risk from individual security risk. These types of measures can help you diversify properly with respect to your individual risk tolerance.
A historical volatility calculation like beta gives you a basic understanding of what the price of a security has done in the past. While past performance is not indicative of future results, historical volatility calculations can be used to help measure risk and ultimately help determine if a security is right for you.
The Volatility of the Volatility – VVIX
To further confuse new traders there is such a thing called the volatility of the volatility – AKA the VIX of the VIX (VVIX). No this is not an exercise in doublespeak. If you are a subscriber you will have heard me talk about this before. The VVIX is simply a measure of the change of volatility in the VIX volatility index. The VVIX is the VIX of the VIX like the VIX is the VIX of stocks. Ok, if you are not thoroughly confused by now then congrats because this stuff can get pretty mind-bending! Another way to put it is, the VVIX measures how rapidly S&P 500 volatility changes, and is thus a measure of the volatility of the index. Investors can use the VVIX and its derivatives to hedge against volatility swings on changes in the VIX options market. You can hedge the hedge!
Why You Shouldn’t Be Afraid of Volatility
All told, volatility is just a measurement that can give you insight into the potential risk of a security. It’s important to remember that actual volatility is almost always less than implied volatility. No measure of risk is going to be totally accurate, anything can happen in the financial markets. Even so, volatility measurements can offer a clear view of risk the market expects.
If you want to learn more about how to trade options, about how to take all factors of options pricing into consideration, and about how to account for volatility in your options trading, please look into our Options Trading Signals. We send trade alerts out weekly and do daily updates on our positions as to why we got in and out along with the factors to our strategies. We trade proprietary strategies you will not find anywhere else. Our goal is to make the market work for us and not try to work the market like everyone else.
You owe it to yourself to have the best tools and subject matter experts on had to ensure you are set up for ultimate success. Don’t trade with one hand behind your back. Rather, expedite your learning curve with the Options Trading newsletter service.
Chris Vermeulen
www.TheTechnicalTraders.com
Chris Vermeulen has been involved in the markets since 1997 and is the founder of Technical Traders Ltd. He is an internationally recognized technical analyst, trader, and is the author of the book: 7 Steps to Win With Logic
Through years of research, trading and helping individual traders around the world. He learned that many traders have great trading ideas, but they lack one thing, they struggle to execute trades in a systematic way for consistent results. Chris helps educate traders with a three-hour video course that can change your trading results for the better.
His mission is to help his clients boost their trading performance while reducing market exposure and portfolio volatility.
He is a regular speaker on HoweStreet.com, and the FinancialSurvivorNetwork radio shows. Chris was also featured on the cover of AmalgaTrader Magazine, and contributes articles to several leading financial hubs like MarketOracle.co.uk
Disclaimer: Nothing in this report should be construed as a solicitation to buy or sell any securities mentioned. Technical Traders Ltd., its owners and the author of this report are not registered broker-dealers or financial advisors. Before investing in any securities, you should consult with your financial advisor and a registered broker-dealer. Never make an investment based solely on what you read in an online or printed report, including this report, especially if the investment involves a small, thinly-traded company that isn’t well known. Technical Traders Ltd. and the author of this report has been paid by Cardiff Energy Corp. In addition, the author owns shares of Cardiff Energy Corp. and would also benefit from volume and price appreciation of its stock. The information provided here within should not be construed as a financial analysis but rather as an advertisement. The author’s views and opinions regarding the companies featured in reports are his own views and are based on information that he has researched independently and has received, which the author assumes to be reliable. Technical Traders Ltd. and the author of this report do not guarantee the accuracy, completeness, or usefulness of any content of this report, nor its fitness for any particular purpose. Lastly, the author does not guarantee that any of the companies mentioned in the reports will perform as expected, and any comparisons made to other companies may not be valid or come into effect.
Chris Vermeulen Archive |
© 2005-2022 http://www.MarketOracle.co.uk - The Market Oracle is a FREE Daily Financial Markets Analysis & Forecasting online publication.