


HUI Gold Stocks: The Illusionist's Trick Left Investors Speechless
Commodities / Gold and Silver Stocks 2021 Jul 07, 2021 - 04:20 PM GMTBy: P_Radomski_CFA

The gold miners’ 2021 gains prompted a standing ovation among investors. However, they didn’t notice a magic trick until everything vanished.
The Gold Miners
After the HUI Index plunged by more than 10% and made all of its 2021 gains disappear, the magic trick left investors in a state of shock. But while Mr. Market still hasn’t sawed the HUI Index in half, the illusionist is likely gearing up for his greatest reveal. Case in point: while the Zig Zag Girl captivated audiences in the 1960s, the HUI Index’s zigzag correction leaves little to the imagination. And with the recent swoon a lot more than just smoke and mirrors, the HUI Index’s short-term optimism will likely vanish into thin air.
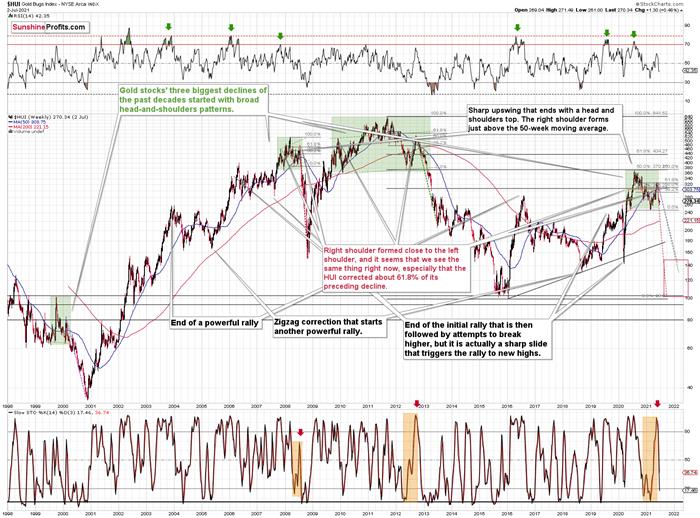
To explain, despite the profound drawdown, the HUI Index hasn’t been able to muster a typical relief rally. Moreover, with ominous signals increasing week by week, if history rhymes (as it tends to), the HUI Index will likely find medium-term support in the 100-to-150 range. For context, high-end 2020 support implies a move back to 150, while low-end 2015 support implies a move back to 100. And yes, it could really happen, even though such predictions seem unthinkable.
Please see below:
Furthermore, the underperformance of gold stocks relative to gold is also worthy of attention. With the junior miners often performing the worst during medium-term drawdowns, short positions in the GDXJ ETF will likely offer the best risk-reward ratio. To that point, if you held firm in 2008 and 2013 and maintained your short positions, you almost certainly realized substantial profits. And while there are instances when it’s wise to exit one’s short positions, the prospect of missing out on the forthcoming slide makes it quite risky.
To explain, I warned that the recent plunge was weeks in the making:
I wrote the following about the week beginning on May 24:
What happened three weeks ago was that gold rallied by almost $30 ($28.60) and at the same time, the HUI – a flagship proxy for gold stocks… Declined by 1.37. In other words, gold stocks completely ignored gold’s gains. That shows exceptional weakness on the weekly basis and is a very bearish sign for the following weeks.
Thus, while the HUI Index remains steady for the time being, back in 2008, the ominous underperformance signaled that trouble was ahead. To explain, right before the huge slide in late September and early October, gold was still moving to new intraday highs; the HUI Index was ignoring that, and then it declined despite gold’s rally. However, it was also the case that the general stock market suffered materially. If stocks hadn’t declined back then so profoundly, gold stocks’ underperformance relative to gold would have likely been present but more moderate.
Nonetheless, the HUI Index’s bearish head & shoulders pattern is extremely concerning. When the HUI Index retraced a bit more than 61.8% of its downswing in 2008 and in between 50% and 61.8% of its downswing in 2012 before eventually rolling over, in both (2008 and 2012) cases, the final top – the right shoulder – formed close to the price where the left shoulder topped. And in early 2020, the left shoulder topped at 303.02. Thus, three of the biggest declines in the mining stocks (I’m using the HUI Index as a proxy here), all started with broad, multi-month head-and-shoulders patterns. And in all three cases, the size of the declines exceeded the size of the head of the pattern.
In addition, when the HUI Index peaked on Sep. 21, 2012, that was just the initial high in gold. At that time, the S&P 500 was moving back and forth with lower highs. And what was the eventual climax? Well, gold made a new high before peaking on Oct. 5. In conjunction, the S&P 500 almost (!) moved to new highs, and despite the bullish tailwinds from both parties, the HUI Index didn’t reach new heights. The bottom line? The similarity to how the final counter-trend rally ended in 2012 (and to a smaller extent in 2008) remains uncanny.
As a result, we’re confronted with two bearish scenarios:
- If things develop as they did in 2000 and 2012-2013, gold stocks are likely to bottom close to their early-2020 high.
- If things develop like in 2008 (which might be the case, given the extremely high participation of the investment public in the stock market and other markets), gold stocks could re-test (or break slightly below) their 2016 low.
Keep in mind though: scenario #2 most likely requires equities to participate. In 2008 and 2020, sharp drawdowns in the HUI Index coincided with significant drawdowns of the S&P 500. However, with the Fed turning hawkish and investors extremely allergic to higher interest rates, the likelihood of a three-peat remains relatively high.
If we turn our attention to the GDX ETF, lower highs and lower lows have become mainstays of the senior miners’ recent performance. Moreover, while the GDX ETF’s swift drawdown occurred on significant volume, the recent bounce hasn’t garnered much optimism. As a result, we’re likely witnessing a corrective upswing within a medium-term downtrend.
Please see below:
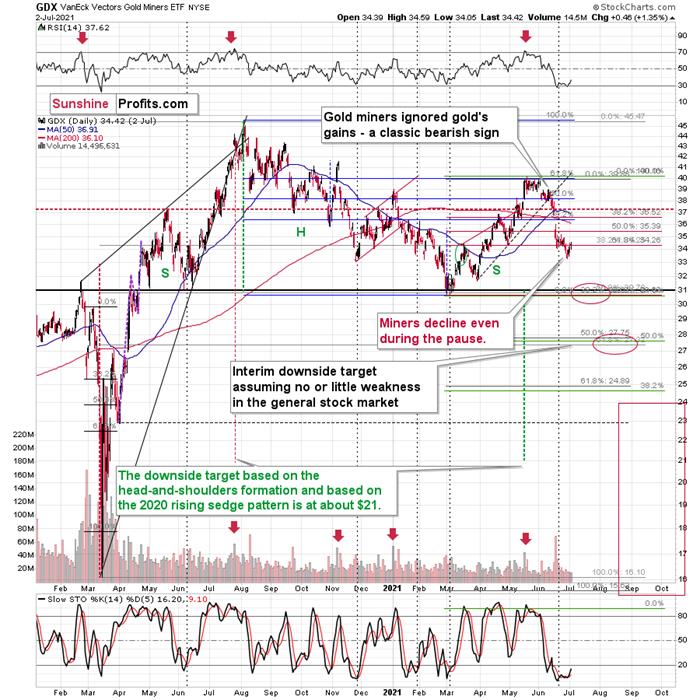
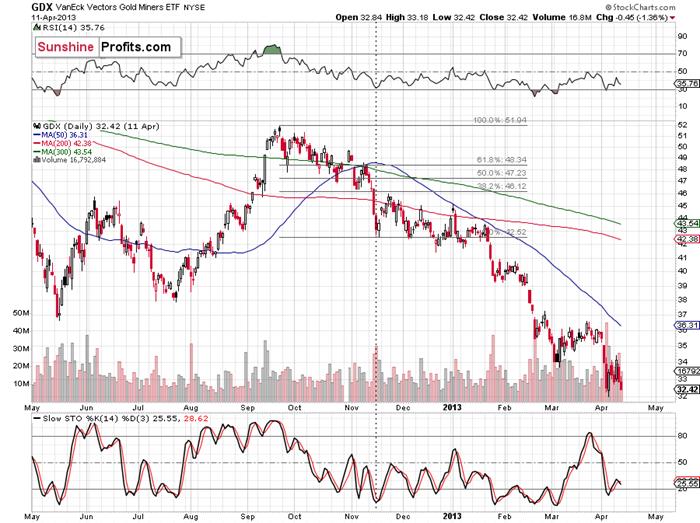
Finally, comparing the current price action to the behavior that we witnessed in 2012, back then, the GDX ETF corrected back to the 38.2% Fibonacci retracement level and then continued to make lower highs before eventually rolling over. And today, the senior miners are displaying similar weakness. Gold stocks are declining even while correcting, and the lack of meaningful upswings signals that the current environment is very bearish.
In conclusion, while gold, silver, and mining stocks will attempt to pull rabbits out of their hats, the bunnies’ bounce will likely fade over the medium term. Moreover, with the precious metals searching for a magic bullet that likely doesn’t exist, another disappointment could leave investors without an ace in the hole. The bottom line? While gold, silver, and mining stocks will likely dazzle the crowd in the years to come, their wizardry could resemble black magic in the coming months.
Today's article is a small sample of what our subscribers enjoy on a daily basis. They know about both the market changes and our trading position changes exactly when they happen. Apart from the above, we've also shared with them the detailed analysis of the miners and the USD Index outlook. Check more of our free articles on our website, including this one – just drop by and have a look. We encourage you to sign up for our daily newsletter, too - it's free and if you don't like it, you can unsubscribe with just 2 clicks. You'll also get 7 days of free access to our premium daily Gold & Silver Trading Alerts to get a taste of all our care. Sign up for the free newsletter today!
Thank you.
Przemyslaw Radomski, CFA
Founder, Editor-in-chief
Tools for Effective Gold & Silver Investments - SunshineProfits.com
Tools für Effektives Gold- und Silber-Investment - SunshineProfits.DE
* * * * *
About Sunshine Profits
Sunshine Profits enables anyone to forecast market changes with a level of accuracy that was once only available to closed-door institutions. It provides free trial access to its best investment tools (including lists of best gold stocks and best silver stocks), proprietary gold & silver indicators, buy & sell signals, weekly newsletter, and more. Seeing is believing.
Disclaimer
All essays, research and information found above represent analyses and opinions of Przemyslaw Radomski, CFA and Sunshine Profits' associates only. As such, it may prove wrong and be a subject to change without notice. Opinions and analyses were based on data available to authors of respective essays at the time of writing. Although the information provided above is based on careful research and sources that are believed to be accurate, Przemyslaw Radomski, CFA and his associates do not guarantee the accuracy or thoroughness of the data or information reported. The opinions published above are neither an offer nor a recommendation to purchase or sell any securities. Mr. Radomski is not a Registered Securities Advisor. By reading Przemyslaw Radomski's, CFA reports you fully agree that he will not be held responsible or liable for any decisions you make regarding any information provided in these reports. Investing, trading and speculation in any financial markets may involve high risk of loss. Przemyslaw Radomski, CFA, Sunshine Profits' employees and affiliates as well as members of their families may have a short or long position in any securities, including those mentioned in any of the reports or essays, and may make additional purchases and/or sales of those securities without notice.
Przemyslaw Radomski Archive |
© 2005-2022 http://www.MarketOracle.co.uk - The Market Oracle is a FREE Daily Financial Markets Analysis & Forecasting online publication.