


How to Recognize a Less\ Than Obvious Opportunity (In focus: Corn)
InvestorEducation / Elliott Wave Theory May 10, 2022 - 03:06 PM GMTBy: EWI

When I was growing up, my father owned and operated a furniture manufacturing company. Its products stocked the shelves of several well-known retail stores across the country, including Walmart.
On the cover of one of his most popular products, a simple D.I.Y. end table, was a picture of the fully assembled table with a framed photograph of a smiling young girl holding a Persian cat. That young girl was me, and the cat was my childhood pet Princess.
Naturally one day the inevitable happened. My dad and I were shopping at Walmart, and we passed a woman with one of his boxed DIY tables in her cart. She looked at me, then at the face staring back at her on the cover of the box, and then again at me.
Visibly shaken, she braved her way over to my dad and asked if, in fact, I was the girl on the box. Without skipping a beat, he grinned and said he saw the resemblance but no, I was not her and we were on our way. I couldn't help looking back to see the woman, standing there glued in place with an utterly baffled expression.
Out of earshot, I asked my dad why he lied. "Trust me," he replied. "We don't want your head getting so big we have to strap you to the roof of the car."
Here's the thing: Every day, "fundamental" analysts say they see the corresponding bullish or bearish news event reflected on the surface of a specific market's fundamental "pool."
Take, for example, the recent rally in corn prices to all-time record highs on April 26. Mainstream analysts cite one catalyst for the grain's gains: The Ukraine war, seeing as Russia and Ukraine account for approximately 20% of the world's corn exports.
From Aljazeera on April 8:
Russia and Ukraine, whose vast grain-growing regions are among the world's main breadbaskets, account for a huge share of the globe's exports in several major commodities, including wheat, vegetable oil and corn, their prices reached their highest levels ever last month.
But if you take a closer look at corn's rally, you'll see the gains began back in October 2021 -- four months before Putin declared his "special military operation" in Ukraine on February 24.
In turn, the mainstreamers were looking at the wrong reflection; namely, that of "market fundamentals," which only show you what's behind, not ahead.
That's where the Wave Principle steps in. For those new to the Wave Principle, it's a form of technical analysis that uses chart patterns and other indicators to anticipate market turns.
It's founded on these core observations:
- Market trends are driven by correlate trends in collective investor psychology
- Investor psychology progresses in 2 modes: impulsive and corrective
- Identifying these patterns correctly can illuminate the near- and long-term path for prices
Recently, we asked three of our top analysts here at Elliott Wave International what pattern or indication they look for most to indicate an important change. The results were too good not to share -- and turn into a FREE ($49 value) resource titled "5 Easy-to-Spot Chart Set-ups to Help You Nail Market Reversals."
This 5-part, all-video collaboration is a masterclass in identifying and implementing these high-confidence arrangements.
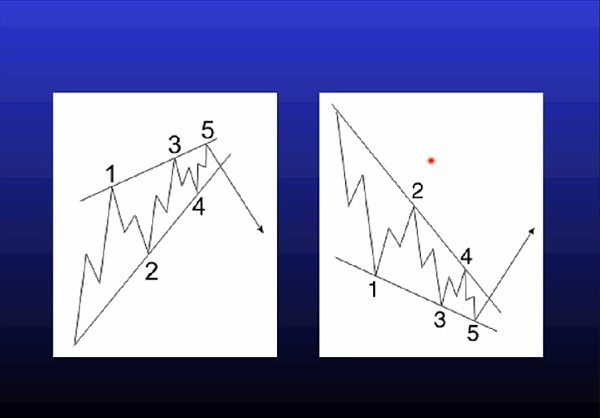
Set-up #2 is taught by EWI analyst Jeffrey Kennedy and focuses on the Elliott wave pattern known as an ending diagonal, defined as:
"This is a terminating wave pattern that may form in the fifth wave position of an impulse or as wave C of an ABC formation. As you can see here, it consists of five waves, waves 1, 2, 3, 4, 5.
"This is why ending diagonals are so formidable. They tend to lead to sharp reversals in price back to beyond the origin of the pattern."
(Jeffrey Kennedy is also the editor of several EWI subscription services including Trader's Classroom and Commodity Junctures Service)
In his 5 Easy-to-Spot Chart Set-ups to Help You Nail Market Reversals video, Jeffrey shows you an example of an ending diagonal that occurred in gold prices back in 2013, which led to a $50/ounce drop.
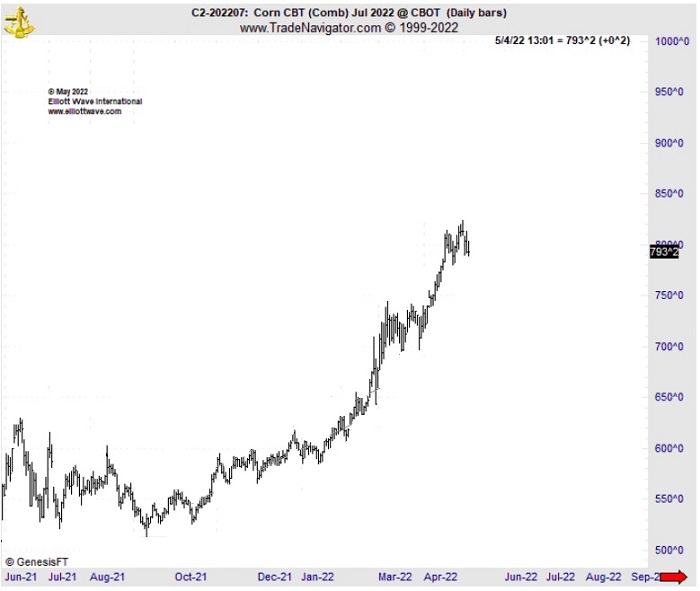
We can also show you an example in the recent history of corn, one that set the stage for its powerful surge long before the Ukraine war began. Here, in his November 2021 Monthly Commodity Junctures, Jeffrey recognized this pattern in a terminating wave C and heeded its potential for signaling sharp, swift reversals:
"Basis the March contract, I believe we have an ending diagonal that terminated in October, so now the stage is set for further rallymoving forward to roughly $7 a bushel.
It's going to be exciting watching this market continue to climb higher in the months ahead.
"I do expect corn ... to make new highs above those we saw in May."
In March, corn touched Jeffrey's initial target. The March Monthly Commodity Junctures' Wave Watch segment presented a new forecast for the grain in which Jeffrey said he "will be looking for further rally up to 801."
And this final chart captures the full range of grain's magnificent gains.
Now you understand why the ending diagonal was included in our "5 Easy-to-Spot Chart Set-ups to Help You Nail Market Reversals" video, and why Jeffrey Kennedy was the chosen instructor for that video lesson.
In it, Jeffrey leaves no questions about this pattern unanswered, including:
- Where they can occur
- How to recognize them on a price chart
- 2 cardinal rules pertaining to each subwave
- And how to time reversals following the pattern
In turn, each of the five lessons from this FREE report are in the best possible hands. And so, you too will be.
Become part of our rapidly growing online Club EWI community and get instant access to the complete "5 Easy-to-Spot Chart Set-ups to Help You Nail Market Reversals" report.
This article was syndicated by Elliott Wave International and was originally published under the headline . EWI is the world's largest market forecasting firm. Its staff of full-time analysts led by Chartered Market Technician Robert Prechter provides 24-hour-a-day market analysis to institutional and private investors around the world.
© 2005-2022 http://www.MarketOracle.co.uk - The Market Oracle is a FREE Daily Financial Markets Analysis & Forecasting online publication.