


Will Ignoring Fundamentals Take Revenge on Bullish Stock Traders?
Stock-Markets / Financial Markets 2022 Jun 10, 2022 - 09:16 PM GMTBy: P_Radomski_CFA

While the Fed strives to tame inflation, short-term investors continue to ruin its efforts with bullish actions. Will their love of risk pay off?
With the S&P 500 enjoying a mid-day rally on Jun. 7 and the GDXJ ETF (proxy for junior gold and silver mining stocks) following suit, the bulls warmed up to the idea of a "soft landing." However, with a much higher U.S. federal funds rate needed to cool inflation, the short-term optimism should be short-lived.
To explain, I've noted on numerous occasions that risk-on sentiment often reverberates across multiple markets. Therefore, when stocks bid higher, commodities usually follow, and this increases the Fed's inflation conundrum. As a result, investors' optimism enhances the pricing pressures.
Please see below:
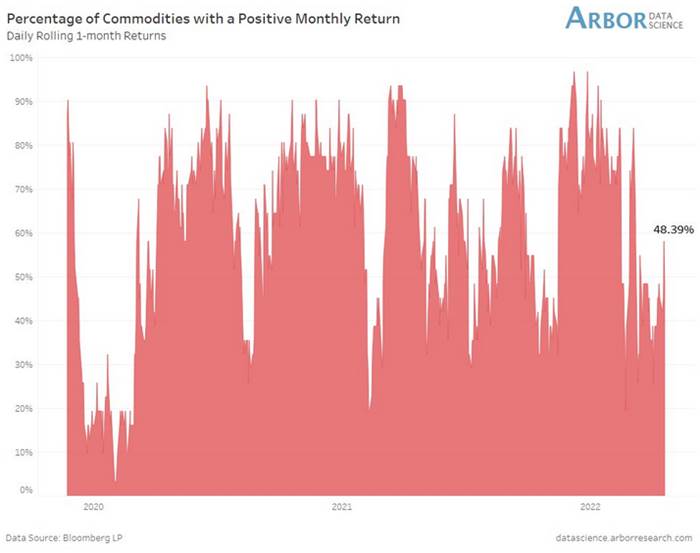
The red bars above track the percentage of commodities experiencing a positive monthly return. If you analyze the right side of the chart, you can see that the negativity in April/May culminated with a smaller percentage of commodities moving higher.
However, the red bar furthest to the right shows that more commodities are rising once again. As a result, if the stock market remains buoyant, the follow-through from commodities will only enhance inflation and elicit more hawkish policy from the Fed.
Furthermore, while investors still hope for a dovish pivot, the U.S. labor market remains on solid footing. Thus, the Fed’s dual mandate of price stability and maximum employment points to more hawkish policy in the coming months.
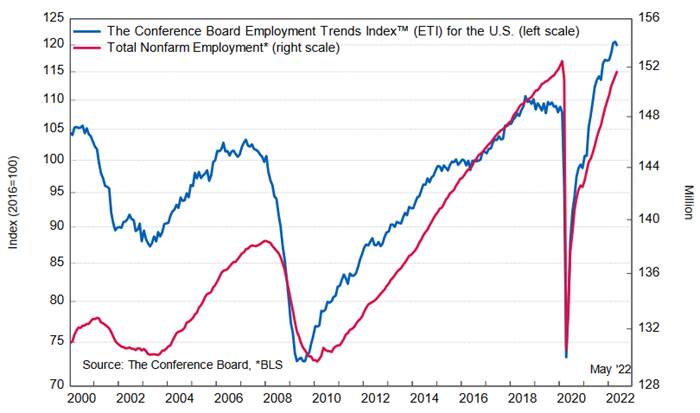
For example, The Conference Board released its Employment Trends Index (ETI) on Jun. 6. The index declined from 120.60 in April (an upward revision) to 119.77 in May. However, all-time highs shouldn’t materialize when the Fed is tightening monetary policy, and the immaterial decline signals there is plenty of work to do to moderate wage inflation.
Agron Nicaj, Associate Economist at The Conference Board, said:
“The Employment Trends Index fell slightly in May, signaling slowing, but positive job growth in the months ahead.... The labor market remains strong amid high inflation and the Federal Reserve is likely to continue its focus on stabilizing prices as a result. A strong response by the Fed risks higher unemployment rates by the end of 2022.”
Please see below:
In addition, while bear market rallies often create doubt among investors, the S&P 500 and the GDXJ ETF are unlikely to maintain their optimism in the months ahead. For example, Morgan Stanley’s Chief U.S. Equity Strategist, Mike Wilson, sees material downside in the summer months.
He told clients that “stocks may rally further in the near term” and “can continue for a few more weeks until the Fed makes it crystal clear they remain hawkish, and earnings revisions fall well into negative territory.” After that, however, he expects the bearish cocktail to “take the S&P toward 3,400 by mid-late August.”
Furthermore, with investors pricing risk like real yields are at all-time lows, I warned on May 19 that we’re likely far from a medium-term bottom. I wrote:
While Fed officials realize that inflation will only subside if commodity and stock prices fall, a near 20% peak-to-trough decline in the S&P 500 still hasn’t spooked market participants. Moreover, while some claim that sentiment is extremely bearish on Wall Street, the reality is that no one fears the Fed.
Please see below:
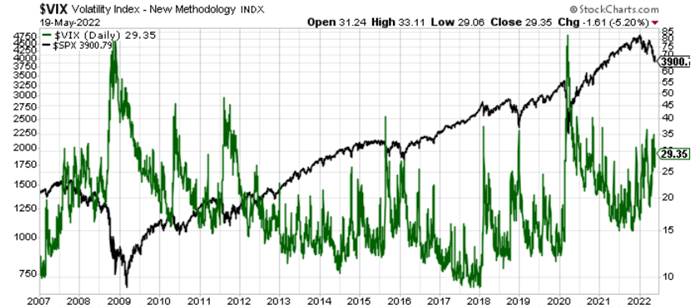
To explain, the black line above tracks the S&P 500, while the green line above tracks the Cboe Volatility Index (VIX). If you analyze the relationship, notice how material spikes in the VIX often mark bottoms for the S&P 500? In a nutshell: when true fear is present, investors rush to buy put options (downside hedges) at any cost, and volatility skyrockets. Therefore, panic is what often creates long-term bottoms.
However, if you analyze the right side of the chart, you can see that the VIX hasn’t even cracked 40 in 2022. Moreover, the VIX has actually declined, even though the S&P 500 remains in free fall. As a result, investors continue to buy call options (upside hedges) as they follow the post-GFC script and await the Fed’s dovish pivot.
Supporting the thesis, Wilson notes that “the price remains wrong with the equity risk premium at 290 [basis points] bps” versus his fair market value of 345 bps. For context, investors discount future earnings/cash flows to determine the appropriate price of a stock, or in this case, the index.
Moreover, when the equity risk premium rises, the discount rate rises, and the asset’s price falls. Thus, with investors still ignoring the risks ahead, a higher discount rate should weigh on the S&P 500 in the coming months.
Likewise, there are many more pieces to the fundamental puzzle. For example, a hawkish Fed is bullish for U.S. real yields and the USD Index. As a result, it’s no surprise that all three moved in tandem in 2022.
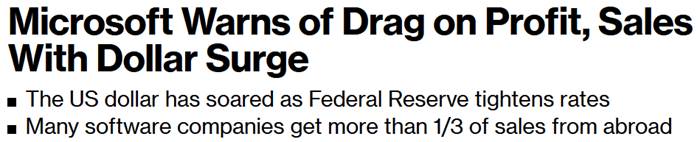
However, earnings revisions – which are upgrades versus downgrades – are negatively correlated to the U.S. dollar. In a nutshell: a rallying greenback reduces foreign demand for S&P 500 companies’ products and dampens their currency-adjusted earnings. For example, Microsoft warned about the dynamic on Jun. 2.
Please see below:
Source: Bloomberg
Therefore, Wilson expects more S&P 500 companies to fall victim to the dollar’s wrath.
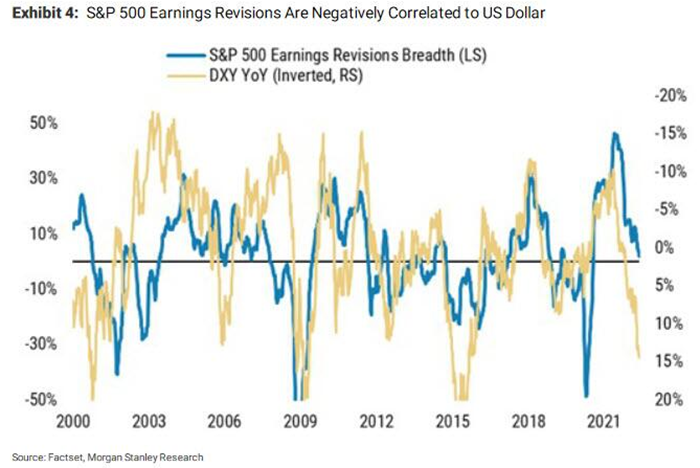
To explain, the blue line above tracks the S&P 500’s earnings revision breadth (the spread of upgrades minus downgrades), while the gold line above tracks the inverted year-over-year (YoY) percentage change in the USD Index. For context, inverted means the latter’s scale is flipped upside down, and a falling gold line represents a rising USD Index.
If you analyze the relationship, you can see that sharp YoY percentage increases in the USD Index often lead to sharp negative revisions in earnings expectations. Moreover, if you focus your attention on the right side of the chart, you can see that the gold line has declined materially, which implies plenty more downward earnings revisions in the months ahead.
Likewise, when you combine the ominous data with two more likely 50 basis point rate hikes in June and July, it’s understandable why Wilson expects the S&P 500 to hit 3,400 before September.
Also noteworthy, seasonal factors point to more earnings woes in the coming months.
Please see below:
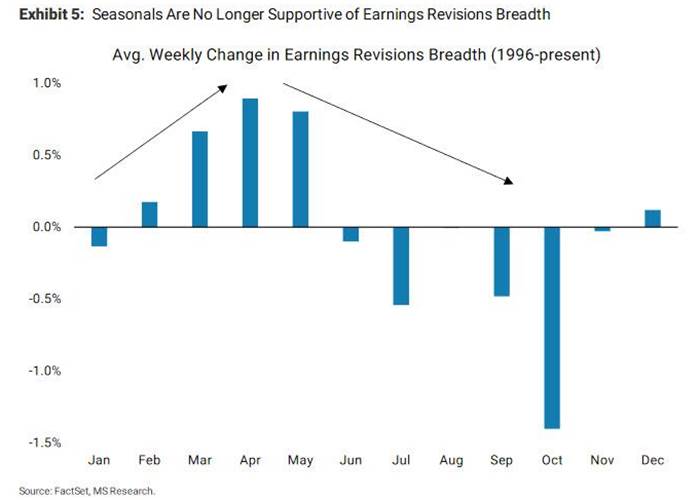
To explain, the blue bars above track the average percentage change in earnings revision breadth since 1996. If you analyze the left side of the chart, you can see that earnings estimates tend to increase leading up to late spring/early summer. However, once the economic boost of warmer weather fades, revisions tend to turn negative as analysts make their fall and winter projections.
For context, analysts and markets are forward-looking. So, the upward revisions in February, March, April, etc. reflect expected performance three and six months later. Likewise, the downward revisions in July, September, October, etc. also reflect expected performance three and six months later. Therefore, with the peak summer months soon to be here and gone, bearish estimates for fall and winter should materialize.
On top of that, I’ve been warning for some time that the U.S. 10-Year real yield would rise in 2022. Moreover, while the metric consolidates in the 0.20% to 0.30% range, the Fed needs higher real yields to curb inflation. As such, further progress should weigh heavily on the S&P 500 and the PMs.
Please see below:
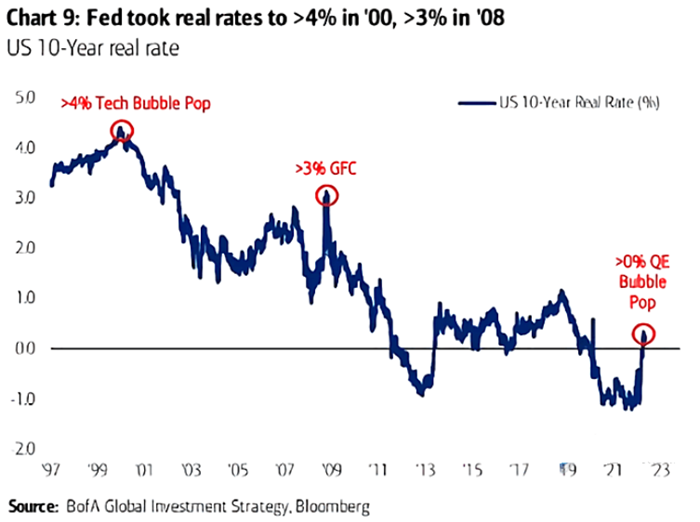
To explain, the blue line above tracks the U.S. 10-Year real yield. If you analyze the annotations, you can see that a higher U.S. 10-Year real yield coincided with the popping of the 2000 dot-com and the 2008 housing bubbles. However, inflation was lower during both of those calamities. As a result, the Fed confronts a more sinister problem today.
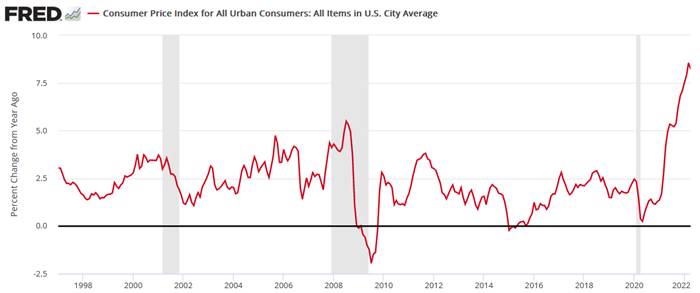
If we line up the dates, the chart below shows that both recessions were preceded by much lower inflation, and therefore, the Fed could pacify investors. In contrast, the U.S. 10-Year real yield is completely out of whack with the current inflation rate. As a result, the Fed needs a miracle to achieve a “soft landing.”
The bottom line? Short-term traders don’t care about fundamentals, and their actions can keep asset prices uplifted for days or weeks. However, fundamental realities always come to bear, and troubling economic developments are not fixed through wishes or words. Therefore, while investors hold on to the idea that things are fine now, history shows that severe shocks should dominate the headlines as the Fed attempts to rein in inflation.
In conclusion, the PMs rallied on Jun. 7, as old habits die hard and the ‘buy the dip’ crowd was out in full force. However, with higher real yields and a stronger USD Index poised to keep the pressure on the S&P 500 and the PMs, lower highs and lower lows should confront the pair over the medium term.
Today's article is a small sample of what our subscribers enjoy on a daily basis. They know about both the market changes and our trading position changes exactly when they happen. Apart from the above, we've also shared with them the detailed analysis of the miners and the USD Index outlook. Check more of our free articles on our website, including this one – just drop by and have a look. We encourage you to sign up for our daily newsletter, too - it's free and if you don't like it, you can unsubscribe with just 2 clicks. You'll also get 7 days of free access to our premium daily Gold & Silver Trading Alerts to get a taste of all our care. Sign up for the free newsletter today!
Thank you.
Przemyslaw Radomski, CFA
Founder, Editor-in-chief
Tools for Effective Gold & Silver Investments - SunshineProfits.com
Tools für Effektives Gold- und Silber-Investment - SunshineProfits.DE
* * * * *
About Sunshine Profits
Sunshine Profits enables anyone to forecast market changes with a level of accuracy that was once only available to closed-door institutions. It provides free trial access to its best investment tools (including lists of best gold stocks and best silver stocks), proprietary gold & silver indicators, buy & sell signals, weekly newsletter, and more. Seeing is believing.
Disclaimer
All essays, research and information found above represent analyses and opinions of Przemyslaw Radomski, CFA and Sunshine Profits' associates only. As such, it may prove wrong and be a subject to change without notice. Opinions and analyses were based on data available to authors of respective essays at the time of writing. Although the information provided above is based on careful research and sources that are believed to be accurate, Przemyslaw Radomski, CFA and his associates do not guarantee the accuracy or thoroughness of the data or information reported. The opinions published above are neither an offer nor a recommendation to purchase or sell any securities. Mr. Radomski is not a Registered Securities Advisor. By reading Przemyslaw Radomski's, CFA reports you fully agree that he will not be held responsible or liable for any decisions you make regarding any information provided in these reports. Investing, trading and speculation in any financial markets may involve high risk of loss. Przemyslaw Radomski, CFA, Sunshine Profits' employees and affiliates as well as members of their families may have a short or long position in any securities, including those mentioned in any of the reports or essays, and may make additional purchases and/or sales of those securities without notice.
Przemyslaw Radomski Archive |
© 2005-2022 http://www.MarketOracle.co.uk - The Market Oracle is a FREE Daily Financial Markets Analysis & Forecasting online publication.