


Stock Market Forecast Current and for Next 30 Years
Stock-Markets / Cycles Analysis Oct 30, 2008 - 10:15 AM GMTBy: Weekly_Wizards

WHEN WILL THE MARKET BOTTOM? Following you will find Daniel Ferrera's cycle forecast of the S&P 500 for the next 30 years, out to 2036, as well as a projection of an expected rally for the next 3 weeks. Read on for details...
FERRERA S&P 500 CYCLE FORECAST TO 2036
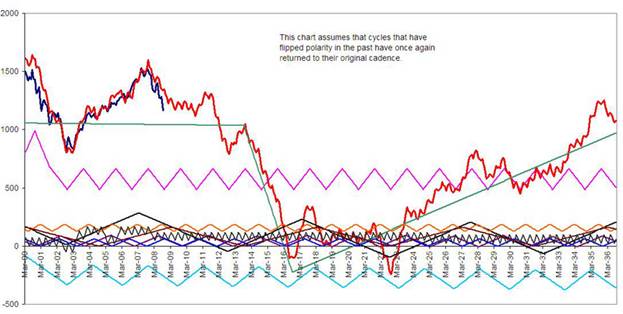
In his breakthrough cycle analysis book, Wheels Within Wheels , released in 2002, financial market analyst Daniel T. Ferrera presented a 100+ year forecast for the stock market to 2108 . Here we present an excerpt from that forecast for the S&P 500 to 2036. The blue line represents the actual market (monthly close only) up to present, and predicted the 2007 top within 1 week , also forecasting the declines we have currently seen. (Note: Regarding these forecasts, please see disclaimer below. Model price scale does not represent exact market scale, but is a relative summation of cycle amplitudes. Though it happened to fit nicely for the last 7 years, timing is the real key!)
WHAT EVERYONE WANTS TO KNOW: WHERE'S THE BOTTOM?
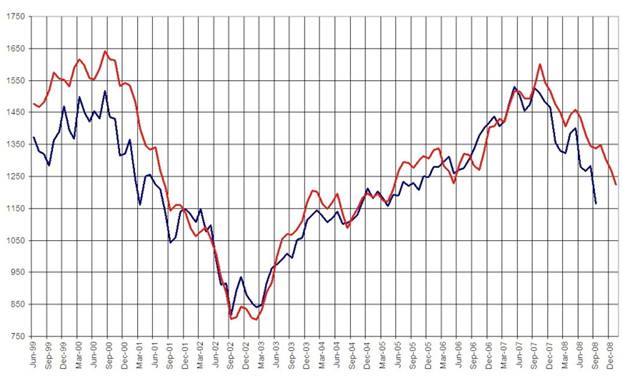
Here we have “zoomed” down into Ferrera's 2002 S&P forecast and compared it (red line) vs. the actual market (blue line) up to the present. Note that the forecast nailed the bottoms of late 2002 and early 2003 and the October 2007 top, and has provided an excellent model of market action to date! But what's next?
FERRERA'S SHORT TERM “MONEYTRAIL” FORECAST
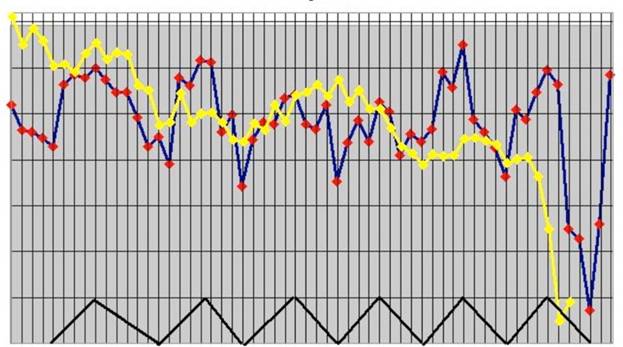
Ferrera presented his weekly “MoneyTrail” indicator in his recent forecast , General Outlook For 2008 , released in January of this year. The "MoneyTrail" indicator accurately forecasted this recent meltdown and is predicting a significant rally for the next three weeks . The yellow line is the S&P 500, the blue line is the forecast, which is around 70% accurate for predicting trend direction and weekly tops and bottoms . There is a pretty strong 8-week cycle that showed up in the data. Money Flow is a displaced 5-period rate of change of the Yield Gap between stocks and high grade bonds. This indicator anticipates the stock market's general direction 5 weeks in advance and currently indicates a 3 week rally though the weeks of November 7th, 14th & 21st, which coincides with the presidential election time period. The General Outlook for 2008 was originally offered at $100, but we have now made this forecast available for free, and you can download it at the following link:
FREE DOWNLOAD OF FERRERA OUTLOOK FOR 2008: http://www.sacredscience.com/ ferrera/Outlook2008.htm
For full details about Daniel T. Ferrera's publications, including Wheels Within Wheels, with it's market forecasts to 2108, and his articles written for Trader's World Magazine, or to sign up for FERRERA'S EMAIL LIST, visit our website: http://www.sacredscience.com/ ferrera
BALANCE OF ORIGINAL ARTICLE DELETED AT THE REQUEST OF THE AUTTHOR - 15TH OCTOBER 2009.
© 2005-2022 http://www.MarketOracle.co.uk - The Market Oracle is a FREE Daily Financial Markets Analysis & Forecasting online publication.