


Gold’s Battle to Break the 2011 High
Commodities / Gold & Silver 2023 Jan 25, 2023 - 10:03 PM GMTBy: P_Radomski_CFA
 Between 2020 and now, quite a lot happened, quite a lot of money was printed, and we saw a war breaking out in Europe. Yet gold failed to rally to new highs.
Gold Had Chances
In fact, it’s trading very close to its 2011 high, which tells you something about the strength of this market. It’s almost absent.
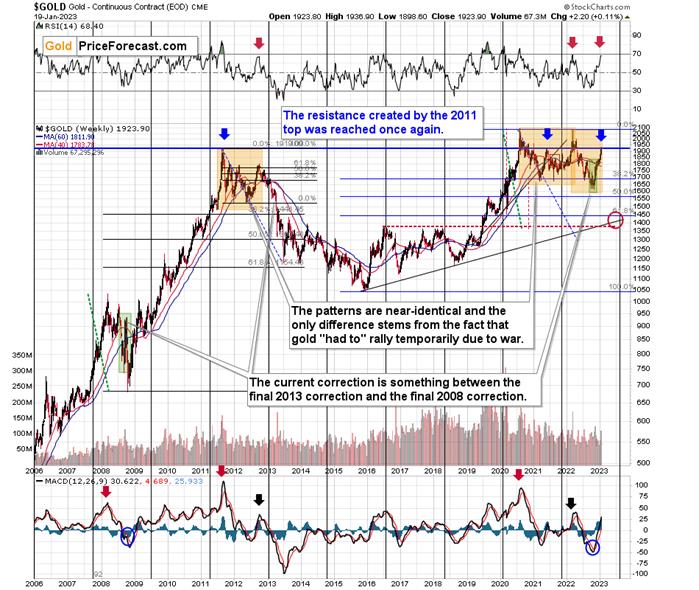
Truth be told, what we see in gold is quite in tune with what we saw after the 2011 top, and in particular, shortly after the 2012 top. We can also spot similarities between now and 2008. The long-term gold price chart below provides details.
Actually, since gold is now practically just where it was a week ago, my Monday’s description of the below gold chart remains up-to-date:
Do you know what levels gold has recently reached? Hint: those are very, very, very important price levels…
Gold just once again reached its 2011 high.
The one that triggered reversals either immediately or after an additional rally (but it took a war outbreak in Europe to push gold temporarily (!) above this level). Therefore, the importance of this long-term resistance can’t be overstated.
That’s one thing. Another thing is that, given the major fundamental event that I already mentioned above (the war outbreak), it’s possible for the technical patterns to be prolonged and perhaps even repeated before the key consequence materialized. Similarly to the head-and-shoulders pattern that can have more than one right head before the breakdown and slide happen.
In gold’s case, this could mean that due to the post-invasion top, the entire 2011-2013-like pattern got two major highs instead of one. And thus, the initial decline and the subsequent correction are pretty much a repeat of what we saw in 2020 and I early 2021, as well as what we saw 2011 and 2012.
The particularly interesting fact (!) about the correction that we saw after the 2011-2012 decline (the one that was followed by the huge 2012-2013 decline) is that during it, gold corrected slightly more than 61.8% of the preceding medium-term decline. Consequently, the current situation is just like what happened back then.
And if all the above wasn’t bearish enough, please take a look at the reading of the RSI indicator based on the weekly price changes. It’s now just below 70, and guess where it was at the final top before the 2012-2013 slide? Yes, it was exactly there, too.
That’s also approximately, where the RSI was at last year’s top.
The orange rectangles on the above chart represent the corrective upswings from approximately the previous local lows. There are two of them, and back in 2013, there was just one corrective upswing, before gold truly plunged.
However, please remember that history doesn’t repeat itself to the letter – it rhymes. This means that two corrections instead of one are still within the scope of the similarity, especially since the first correction wasn’t as big as the 2008 one.
The current situation is truly special, as the rate hikes are something that we haven’t seen in a long time. The same goes for the level of concern about the inflation that’s “out there.” The latter implies that when faced with a decision about whether to fight inflation or help the economy, the Fed is likely to lean toward the former. That’s bearish for assets like gold.
Looking at gold from the short-term point of view, reveals that gold is trying to verify the breakout above its 61.8% Fibonacci retracement.
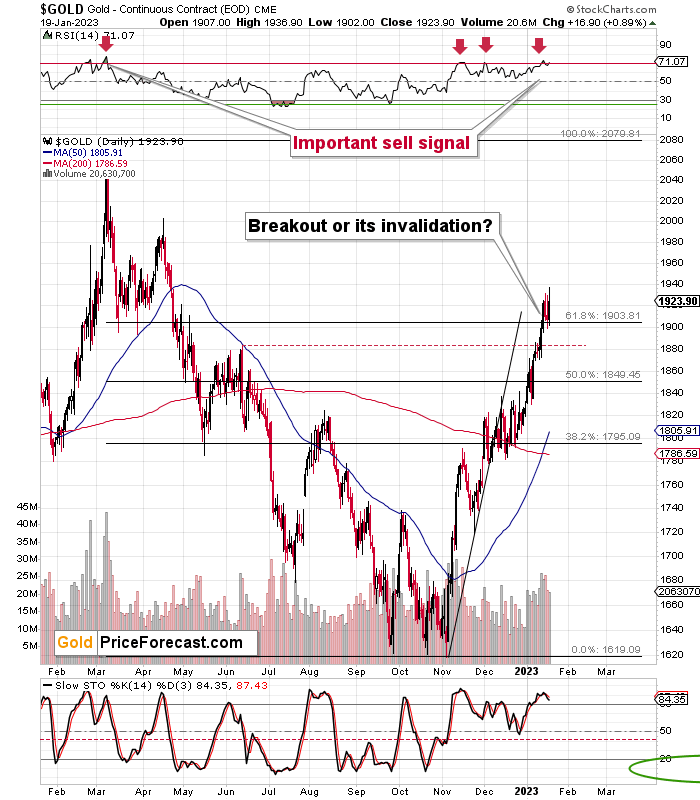
The Battle for $1,900
Trying, but not necessarily succeeding at it. Even though the rallies above the $1,900 level and the 61.8% Fibonacci retracement level were more visible than moves back below those levels, the latter still happened.
This, combined with an RSI above 70 – which is a classic sell signal that confirmed, e.a., the 2022 top – makes it very likely that “the battle for $1,900” will be lost.
Let’s zoom even further.
On the chart below (courtesy of https://GoldPriceForecast.com), you can see that while gold made another intraday attempt to move above the recent short-term highs and silver attempted to once again move above $24, both moves failed.
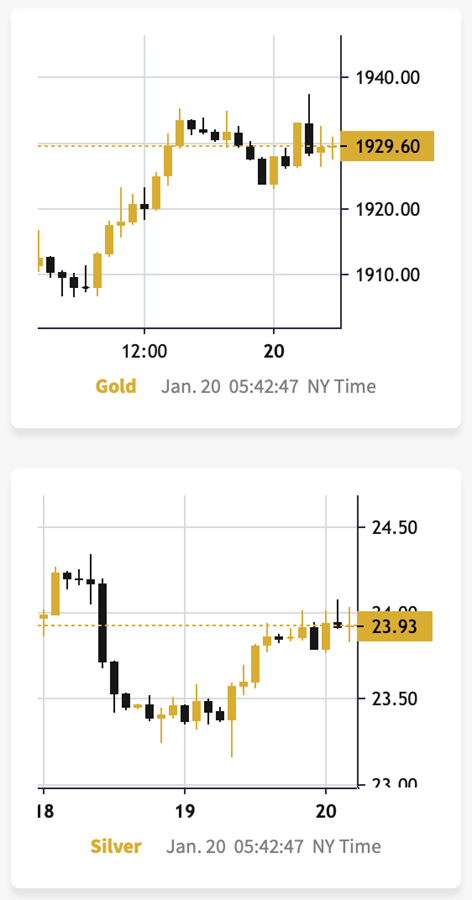
This indicates that the rally’s days are likely numbered.
Naturally, the above is up-to-date at the moment when it was written. When the outlook changes, I’ll provide an update. If you’d like to read it as well as other exclusive gold and silver price analyses, I encourage you to sign up for our free gold newsletter.
Przemyslaw Radomski, CFA
Founder, Editor-in-chief
Tools for Effective Gold & Silver Investments - SunshineProfits.com
Tools für Effektives Gold- und Silber-Investment - SunshineProfits.DE
* * * * *
About Sunshine Profits
Sunshine Profits enables anyone to forecast market changes with a level of accuracy that was once only available to closed-door institutions. It provides free trial access to its best investment tools (including lists of best gold stocks and best silver stocks), proprietary gold & silver indicators, buy & sell signals, weekly newsletter, and more. Seeing is believing.
Disclaimer
All essays, research and information found above represent analyses and opinions of Przemyslaw Radomski, CFA and Sunshine Profits' associates only. As such, it may prove wrong and be a subject to change without notice. Opinions and analyses were based on data available to authors of respective essays at the time of writing. Although the information provided above is based on careful research and sources that are believed to be accurate, Przemyslaw Radomski, CFA and his associates do not guarantee the accuracy or thoroughness of the data or information reported. The opinions published above are neither an offer nor a recommendation to purchase or sell any securities. Mr. Radomski is not a Registered Securities Advisor. By reading Przemyslaw Radomski's, CFA reports you fully agree that he will not be held responsible or liable for any decisions you make regarding any information provided in these reports. Investing, trading and speculation in any financial markets may involve high risk of loss. Przemyslaw Radomski, CFA, Sunshine Profits' employees and affiliates as well as members of their families may have a short or long position in any securities, including those mentioned in any of the reports or essays, and may make additional purchases and/or sales of those securities without notice.
Przemyslaw Radomski Archive |
© 2005-2022 http://www.MarketOracle.co.uk - The Market Oracle is a FREE Daily Financial Markets Analysis & Forecasting online publication.