Could Silver Price Outperform Gold Again?
Commodities / Gold & Silver 2023 Feb 07, 2023 - 08:17 AM GMTBy: Richard_Mills
Gold sold off following the US Federal Reserve’s Feb. 1 decision to raise interest rates another 25 basis points. The federal funds rate now sits at between 4.50 and 4.75%.
Spot gold at first gained about $20 to $1,956, within $80 of the all-time high of $2,034, reached in August, 2020. The dollar fell Wednesday along with bond yields.
The market’s initial take was that the Fed is nearly finished raising rates. A senior investment strategist from Allianz Investment Management told CNBC that the messaging leaned “slightly dovish”, with the lack of clarity signaling that the Fed is nearing the end of its rate tightening cycle.
After hikes end, Charlie Ripley said the central bank will likely “sit tight while the economic data catches up to the policy.”
“The Fed is essentially speaking out of both sides of the mouth as they signaled further increases are appropriate, but also acknowledged they will consider the cumulative amount of tightening in future policy decisions,” he said.
Fed Chair Jerome Powell made clear that the battle against inflation is not won, stating “It would be very premature to declare victory, or to think that we’ve really got this.” He indicated that the central bank could raise rates a couple more times this year.
Digesting that information, on Thursday metal traders hit sell, with the price of gold falling $38.50 to finish the trading day in New York at $1,911.50. Gold, which does not pay interest or a dividend, typically moves in the opposite direction to interest rate/ bond yield increases.
Silver saw a similar trend, rising to $24.50 on Feb. 1, then falling Thursday to close the session $0.51 lower, at $23.41.
Predicting the price of gold and silver is difficult, but one of the most useful clues for determining their directions, is the gold-silver ratio.
Gold-silver ratio
We use the gold-silver ratio to find out how silver prices compare to gold. The ratio is the amount of silver one can buy with an ounce of gold. Simply divide the current gold price by the price of silver.
Current indications show that silver is undervalued. Right now the gold-silver ratio is 78:1, meaning it takes 78 oz of silver to buy one ounce of gold. Historically the average was 15:1, since the seventies, when Nixon decoupled the dollar from gold, the ratio has been 65:1. And historically, the ratio has always returned to the mean.
See the chart below, and linked commentary by Schiffgold.com, showing that Historically, when the spread gets [above 80], silver doesn’t just outperform gold, it goes on a massive run in a short period of time. Since January 2000, this has happened four times. As this chart shows, the snapback is swift and strong.
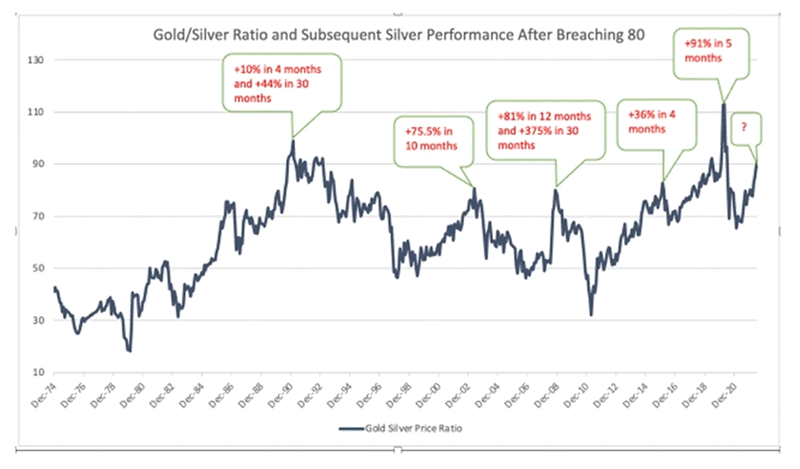
Source: Schiffgold.com
A one-year chart shows the ratio narrowing to around 75 at the end of last year, before breaching 80 in January.
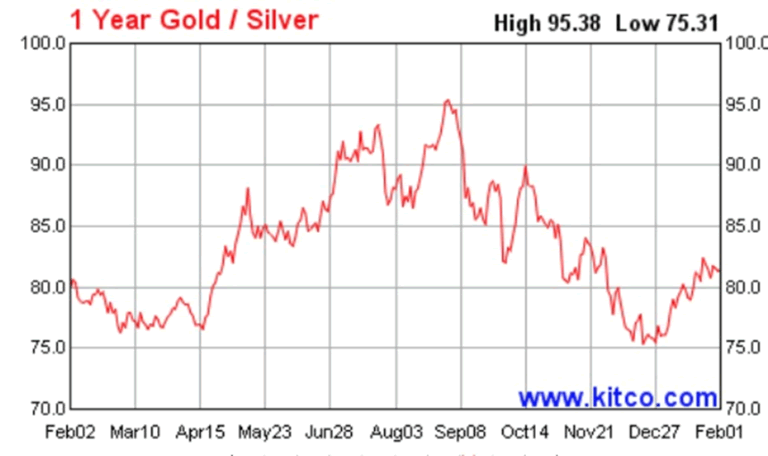
Source: Kitco
When precious metals rallied in 2020, on the back of lockdowns, interest rates slashed to zero, QE, and general market fear, silver’s gain was double that of gold. The price ran up 43% from January to December, 2020, compared to gold’s mere 20.8% rise. Earlier in the year, as gold punched above $2,000 an ounce, a 39% gain, silver rallied to nearly $30 an ounce, a 147% increase.
Meanwhile, the silver-gold ratio fell from over 100:1 to just over 64:1.
History
In recent history, the gold-silver ratio was highest in April, 2020, following the onset of the covid-19 pandemic. At that time, the price of gold outpaced silver by more than 125 to 1.
Going back further, we find the gold-silver ratio resting somewhere between 10 and 15:1, reflecting the supply of each metal. There were times throughout the history of money where the ratio was even lower — China once had a 4 to 1 ratio and the ancient Egyptians even had a 1 to 1 ratio at one point. (Longtermtrends.net)
Zero Hedge comes up with some interesting historical facts about the gold-silver ratio:
- The earliest recorded instance of the gold-to-silver ratio dates back to 3200 BCE, when Menes, the first king of Ancient Egypt set a ratio of 2.5:1.
- Ancient Rome was one of the earliest ancient civilizations to set a gold-to-silver ratio, starting as low as 8:1 in 210 BCE. Over the decades, varying gold and silver inflows from Rome’s conquests caused the ratio to fluctuate between 8-12 ounces of silver for every ounce of gold. By 46 BCE, Julius Caesar had established a standard gold-to-silver ratio of 11.5:1, shortly before it was bumped to 11.75:1 under emperor Augustus.
- As centuries progressed, ratios around the world fluctuated between 6-12 ounces of silver for every ounce of gold, with many Middle Eastern and Asian empires and nations often valuing silver more highly than Western counterparts, thus having a lower ratio.
- By the 18th century, the gold-to-silver ratio was being redefined by the US government’s Coinage Act of 1792, which set the ratio at 15:1. This act was the basis for US coinage, defining coins’ values by their metallic compositions and weights.
- Around the same time period, France had enacted a ratio of 15.5:1, however, neither of these fixed ratios lasted long. The growth of the industrial revolution and the volatility of two world wars resulted in massive fluctuations in currencies, gold and silver. By the 20th century, the ratio had already reached highs of around 40:1, with the start of World War II further pushing the ratio to a high of nearly 100:1.
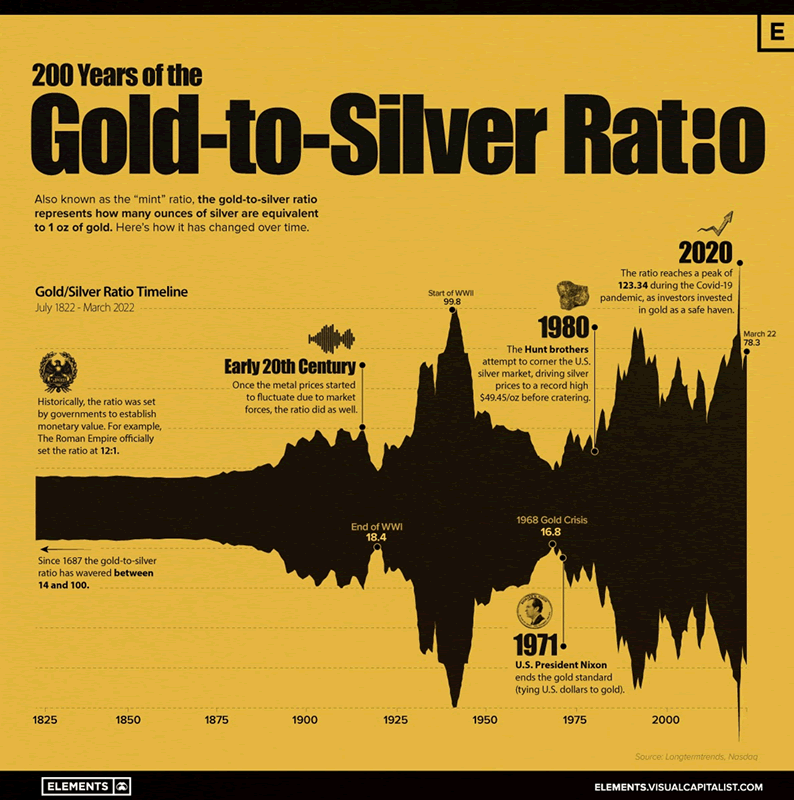
Source: Visual Capitalist
Price movers
Back to modern day, what is behind the sharp movement in the price of silver relative to gold? According to CME Group there are three factors:
- Differences in the end uses of silver and gold
- The decline in conventional photography, and the energy transition
- Fluctuations in Chinese demand.
We know from previous articles that silver is more of an industrial metal than gold, which has mainly a monetary function — although gold like silver is used widely in jewelry.
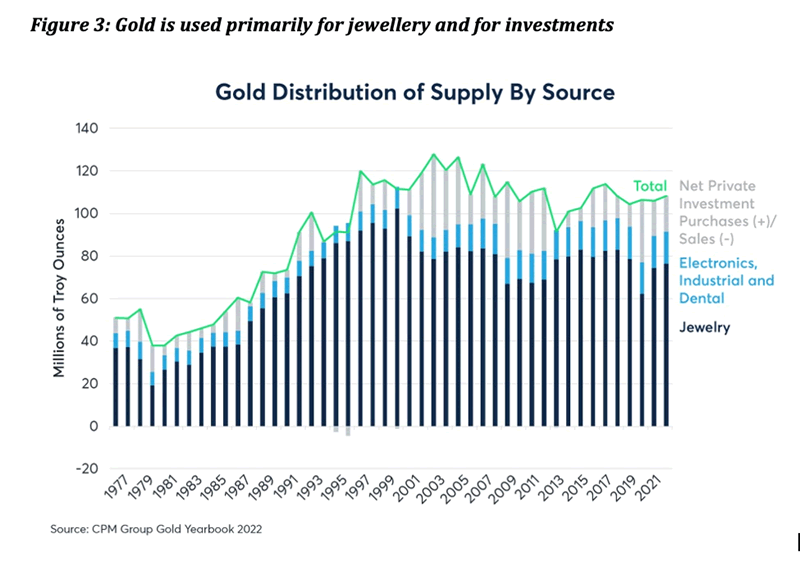
CME Group notes that Historically, silver often outperformed gold during periods of strong economic expansion during which industrial economies boomed, and tended to underperform gold during periods of economic stress.
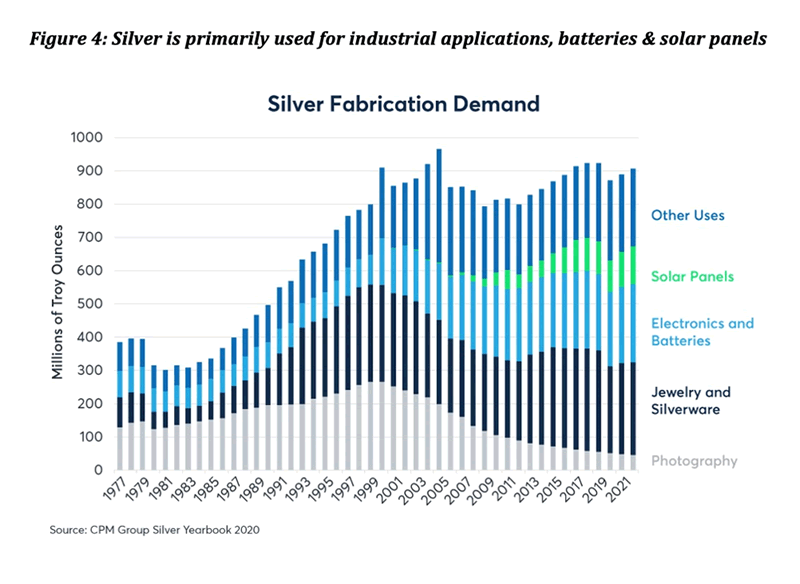
A turning point for silver occurred in the late 1990s, with the decline of traditional photography. In 1999, 267 million ounces of silver were used to develop photographs. By 2021 that number had fallen by 83%, with the advent of digital cameras erasing about 20% of silver use within two decades.
Luckily for silver investors, however, the energy transition has created a new use for the white metal. In 2021, CME Group reports that 114 million troy ounces were used to create solar panels, and demand for silver used in batteries and electronics has doubled since the ‘90s.
In CME’s third bullet point, I learned something new: that Chinese growth may determine short-term fluctuations in the gold-silver ratio. (Perhaps it shouldn’t be a surprise, given the role of silver in Chinese history). Here’s how it works:
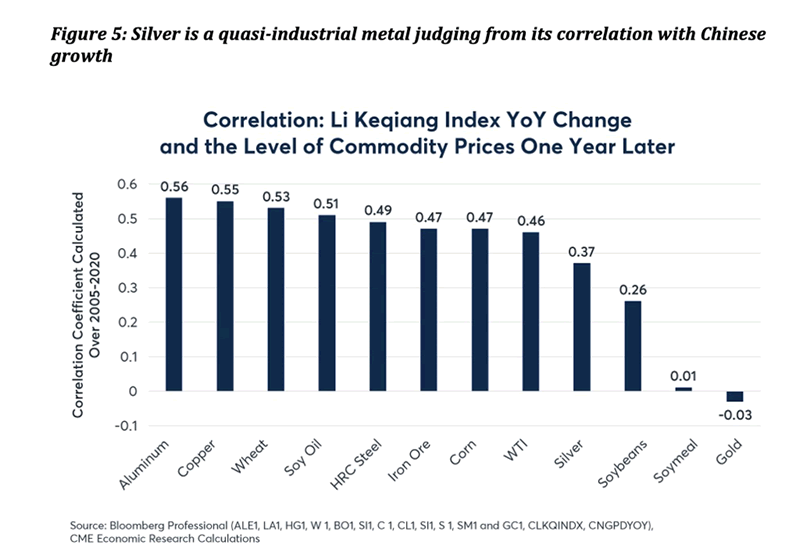
Short-term changes in the gold-silver ratio appear to follow the pace of growth in China’s industrial sector. We use the Li Keqiang Index, a measure that tracks bank loans, rail freight volumes and electricity production, as a proxy for Chinese industrial growth. The index shows exceptionally strong positive correlations with the prices of many commodities one-year forward. While silver is not among the most highly correlated with the index from 2005 to 2021, a change in the pace of growth as measured by the index still showed a +0.37 correlation with the price of silver, less than industrial metals like aluminum and copper, but higher than gold. Among the major commodities, gold is the only one to show a negative (albeit slightly) correlation with Chinese growth (Figure 5).
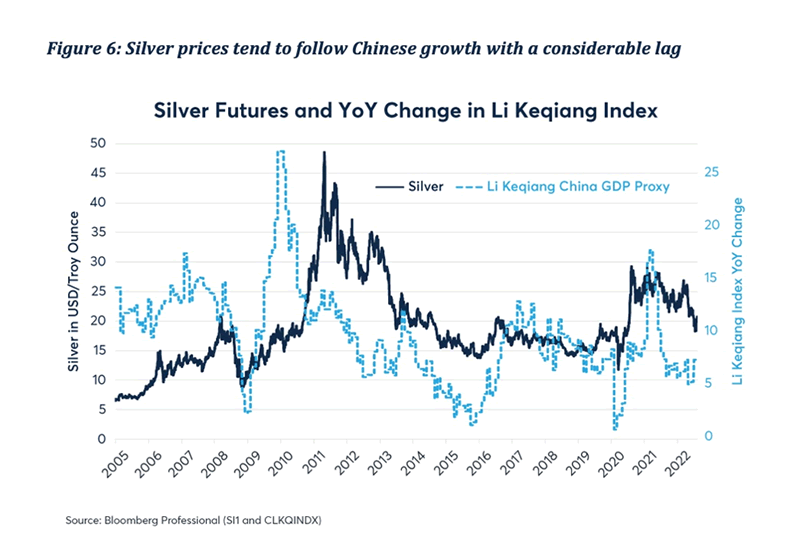
Silver prices rose sharply from 2005 to 2007 following a period of strong growth in China. They then fell sharply in 2008 as China’s economy slowed a great deal during the early stages of the U.S. sub-prime crisis. Starting in 2009 Chinese growth surged as China launched a massive stimulus program that took the growth rate of its industrial sector up to 27% year on year. Silver prices soared in the wake of this extraordinary Chinese boom, eventually rising towards $50 per ounce in 2011. By this time, however, China’s economy had begun to slow sharply and silver prices fell with it. Silver’s extraordinary rebound versus gold in 2020 and 2021 may relate to the rebound in growth that China experienced in late 2020 and early 2021 as they were the first nation to emerge from pandemic lockdowns. However, China’s growth slowed considerably [last year] and that might explain why silver underperformed gold in [2022] (Figure 6).
Marketwatch noted this week it’s a good sign for the global economy that silver has outpaced gold’s gains in the past three months.
Comex silver futures’ nearly 25% climb from Oct. 31 to Jan. 31, compared to gold’s 19% advance, is “a statistically unusual amount that shows the precious metals market is bullish on global economic growth in 2023,” wrote Nicholas Colas, co-founder of DataTrek Research, in a Jan. 25 report.
Colas pointed out that silver is mostly an industrial metal, and he attributed the global economy being in better shape than feared, primarily to China’s economic re-opening.
Others say the upward price moves for industrial metals, not just silver but copper and iron ore, is not only due to China. Michael Cuggino, president and portfolio manager of the Permanent Portfolio Family of Funds, told Marketwatch The demand increase for silver is expected to come from not only conventional industrial needs, such as construction and technology, but also from the global push toward clean-energy production and related goods such as electric vehicles.
Cuggino adds that, if China continues to reopen and there isn’t a recession, supply and demand factors could be a “tailwind to commodity prices.” Marketwatch states:
With the right mix of factors, silver could go a lot higher, “easily into the $30s,” Cuggino says, but also “back down to the teens if a significant global or U.S. recession occurs.”
What does AOTH expect?
Inflation is slowing, and I was right in my prediction that the Fed would reduce its level of interest rate increases on Feb. 1 from 0.5% to 0.25%.
But it’s really never been about how much each raise will be. The problem is the minimum 5% interest rate target, called for the rest of the year. That’s what is really going to break everything. We have barely begun to feel any impact of that, let alone the full impact.
Soaring credit card debt, mortgage rates financed at a higher rate means rents soar and a massive rollover of short-term government debt (<1% to 5% are serious issues). High long-term interest rates (along with soaring food prices) directly aimed at the consumer are what will break the US & global economy and give the Fed and other central banks what they want – a massive decrease in demand by crushing the consumer who is 70% of both the US and global economy; they will have tamed inflation.
Of course rising interest rates are a double-barreled shotgun pointed at both consumers and the Fed. Most federal debt is short term, two years, it was easy to make payments at 0.25% but 5% is a different animal altogether.
The questions I ask myself are: a/ who is going to finance that massive debt mountain of US$32T with global de-dollarization underway? b/ when will the Fed have to return to QE and start printing money just to make interest payments?
Circling back to the 0.25% Fed rate hike, Chairman Powell made a comment claiming that consumer expectations cause inflation.
Peter Schiff strongly disagrees, stating in a recent column that “Inflation is caused by the government. It’s caused by the Federal Reserve printing money and Congress spending it.”
Damn straight. Like Schiff, I don’t think that inflation is over, how can it be? Not only is food continuing to get more expensive, but de-investment in fossil fuels will lead to supply shortages and higher prices of crude oil, gasoline, natural gas and diesel fuel. There are thousands of goods derived from fossil fuels whose prices will go up, too. Then there are metals such as copper, zinc and silver, all of which are facing supply issues but are heavily in demand from electrification and decarbonization. Goldman Sachs is predicting $12,000 copper by 2024.
The fossil fuel elephant in the electrification room
Schiff has been one of the few voices of doom continuing to warn of a recession and I agree with him on that, too.
He states, My pessimism is rooted in the fact that the US economy is addicted to easy money. It is addicted to artificially low interest rates and quantitative easing. You can’t take an addict’s drug away without sending him into withdrawal. The economy can only limp along so long with tighter monetary policy.
Gold and silver saw significant selling pressure last year despite being in an extreme inflationary environment. This year is looking completely different. A month into 2023, and gold is up 15% versus silver’s 20% gain. Precious metals are rallying due to a combination of a lower US dollar and an expected moderation of Fed rate hikes.
Richard (Rick) Mills
aheadoftheherd.com
subscribe to my free newsletter
Legal Notice / Disclaimer
Ahead of the Herd newsletter, aheadoftheherd.com, hereafter known as AOTH.
Please read the entire Disclaimer carefully before you use this website or read the newsletter. If you do not agree to all the AOTH/Richard Mills Disclaimer, do not access/read this website/newsletter/article, or any of its pages. By reading/using this AOTH/Richard Mills website/newsletter/article, and whether you actually read this Disclaimer, you are deemed to have accepted it.
Any AOTH/Richard Mills document is not, and should not be, construed as an offer to sell or the solicitation of an offer to purchase or subscribe for any investment.
AOTH/Richard Mills has based this document on information obtained from sources he believes to be reliable, but which has not been independently verified.
AOTH/Richard Mills makes no guarantee, representation or warranty and accepts no responsibility or liability as to its accuracy or completeness.
Expressions of opinion are those of AOTH/Richard Mills only and are subject to change without notice.
AOTH/Richard Mills assumes no warranty, liability or guarantee for the current relevance, correctness or completeness of any information provided within this Report and will not be held liable for the consequence of reliance upon any opinion or statement contained herein or any omission.
Furthermore, AOTH/Richard Mills assumes no liability for any direct or indirect loss or damage for lost profit, which you may incur as a result of the use and existence of the information provided within this AOTH/Richard Mills Report.
You agree that by reading AOTH/Richard Mills articles, you are acting at your OWN RISK. In no event should AOTH/Richard Mills liable for any direct or indirect trading losses caused by any information contained in AOTH/Richard Mills articles. Information in AOTH/Richard Mills articles is not an offer to sell or a solicitation of an offer to buy any security. AOTH/Richard Mills is not suggesting the transacting of any financial instruments.
Our publications are not a recommendation to buy or sell a security – no information posted on this site is to be considered investment advice or a recommendation to do anything involving finance or money aside from performing your own due diligence and consulting with your personal registered broker/financial advisor.
AOTH/Richard Mills recommends that before investing in any securities, you consult with a professional financial planner or advisor, and that you should conduct a complete and independent investigation before investing in any security after prudent consideration of all pertinent risks. Ahead of the Herd is not a registered broker, dealer, analyst, or advisor. We hold no investment licenses and may not sell, offer to sell, or offer to buy any security.
If you're interested in learning more about the junior resource and bio-med sectors please come and visit us at www.aheadoftheherd.com Site membership is free. No credit card or personal information is asked for.
Richard is host of Aheadoftheherd.com and invests in the junior resource sector. His articles have been published on over 400 websites, including: Wall Street Journal, Market Oracle, USAToday, National Post, Stockhouse, Lewrockwell, Pinnacledigest, Uranium Miner, Beforeitsnews, SeekingAlpha, MontrealGazette, Casey Research, 24hgold, Vancouver Sun, CBSnews, SilverBearCafe, Infomine, Huffington Post, Mineweb, 321Gold, Kitco, Gold-Eagle, The Gold/Energy Reports, Calgary Herald, Resource Investor, Mining.com, Forbes, FNArena, Uraniumseek, Financial Sense, Goldseek, Dallasnews, Vantagewire, Resourceclips and the Association of Mining Analysts.
Copyright © 2022 Richard (Rick) Mills - All Rights Reserved
Legal Notice / Disclaimer: This document is not and should not be construed as an offer to sell or the solicitation of an offer to purchase or subscribe for any investment. Richard Mills has based this document on information obtained from sources he believes to be reliable but which has not been independently verified; Richard Mills makes no guarantee, representation or warranty and accepts no responsibility or liability as to its accuracy or completeness. Expressions of opinion are those of Richard Mills only and are subject to change without notice. Richard Mills assumes no warranty, liability or guarantee for the current relevance, correctness or completeness of any information provided within this Report and will not be held liable for the consequence of reliance upon any opinion or statement contained herein or any omission. Furthermore, I, Richard Mills, assume no liability for any direct or indirect loss or damage or, in particular, for lost profit, which you may incur as a result of the use and existence of the information provided within this Report.
© 2005-2022 http://www.MarketOracle.co.uk - The Market Oracle is a FREE Daily Financial Markets Analysis & Forecasting online publication.


