How "Insane Optimism" is at Work in the Stock Market
Stock-Markets / Stock Market 2023 May 05, 2023 - 11:11 PM GMTBy: EWI
"Stock investors are so bullish that they are..."
Many technical indicators are highly useful, yet the price moves of the stock market really boil down to two things: optimism and pessimism.
Major trend turns tend to occur when extremes are reached in either optimism or pessimism.
Most recently, optimism has been in charge. The question is: Has an extreme been reached?
Well, there are at least two signs which strongly point to a "yes" answer.
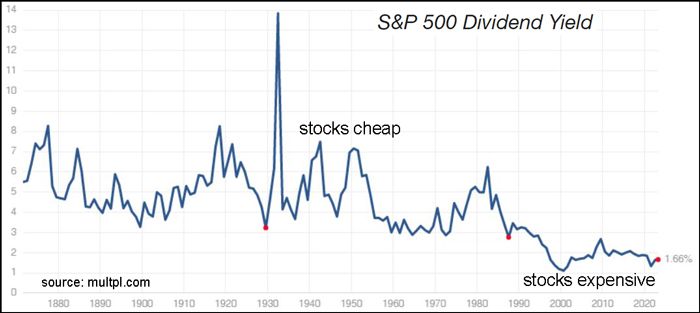
The first sign to which I'd like to call your attention regards the S&P 500 dividend yield. What you need to know is that stock prices tend to top when dividend yields are low and bottom when they're high.
Robert Prechter explains how this is related to optimism and pessimism in his recently published April Elliott Wave Theorist, which covers major financial and social trends:
Investors in a positive mood bid up stock prices regardless of dividend yield, and investors in a negative mood adjust stock prices lower regardless of dividend yield. Yield simply follows the waves of optimism and pessimism.
The April Theorist provided more insight with this chart and associated commentary:

[The chart] shows that S&P companies' dividends today yield only 1.66% annually. Investors are putting up with that low payout despite the virtually riskless 5% yield of Treasury bills, which is three times as much. Stock investors are so bullish that they are certain their capital gains will make dividends irrelevant.
The second sign of insane optimism is revealed in this March 29 Bloomberg news item:
They've become a high-speed, high-risk, high-reward tool in turbulent markets: Options with shelf lives so short they expire in less than a day [known as "zero-day-to-expiry' options].
... Success is far from certain, and even some Wall Street pros don't fully understand them.
That hasn't deterred thrill-seeking retail investors from piling into 0DTE options.
As the April Theorist says:
Options Gambling Is Another Symptom of Historic Optimism
Looking beyond sentiment extremes, the April Theorist also shows the stock market's Elliott wave structure in monthly and hourly charts. The information revealed in these charts is very much worth knowing.
If you're unfamiliar with Elliott wave analysis, read Frost & Prechter's Wall Street classic, Elliott Wave Principle: Key to Market Behavior. Here's a quote:
All waves may be categorized by relative size, or degree. The degree of a wave is determined by its size and position relative to component, adjacent and encompassing waves. Elliott named nine degrees of waves, from the smallest discernible on an hourly chart to the largest wave he could assume existed from the data then available. He chose the following terms for these degrees, from largest to smallest: Grand Supercycle, Supercycle, Cycle, Primary, Intermediate, Minor, Minute, Minuette, Subminuette. Cycle waves subdivide into Primary waves that subdivide into Intermediate waves that in turn subdivide into Minor waves, and so on. The specific terminology is not critical to the identification of degrees, although out of habit, today's practitioners have become comfortable with Elliott's nomenclature.
If you'd like to read the entire online version of the book, you may do so for free once you join Club EWI, the world's largest Elliott wave educational community.
A Club EWI membership is also free.
Get started now by following this link: Elliott Wave Principle: Key to Market Behavior -- get free and instant access.
This article was syndicated by Elliott Wave International and was originally published under the headline How "Insane Optimism" is at Work in the Stock Market. EWI is the world's largest market forecasting firm. Its staff of full-time analysts led by Chartered Market Technician Robert Prechter provides 24-hour-a-day market analysis to institutional and private investors around the world.
© 2005-2022 http://www.MarketOracle.co.uk - The Market Oracle is a FREE Daily Financial Markets Analysis & Forecasting online publication.


