


Stock Markets Finding More Promising Signs of a Turnaround
Stock-Markets / Global Stock Markets Dec 02, 2008 - 11:44 AM GMTBy: Frank_Holmes

 As the final month of 2008 begins, let's look back at November -- a month that featured a number of promising signs that a market recovery could be drawing nearer.
U.S. markets— According to probability models from Thomas Weisel, the S&P 500 has been a “Buy” since November 21, the day that index closed at 800. They say a verification could come in early December, when monthly liquidity figures come out—if there is extreme positive liquidity to accompany the technical “Buy” signal, history shows that on average there's a six-month price rally of 18.5 percent.
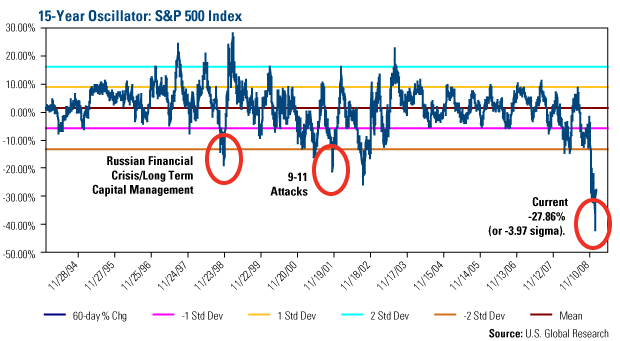
Our oscillator tells us that, statistically speaking, the S&P 500 is extremely oversold and thus due for a reversal toward the mean. The 15-year chart above shows that the S&P 500 is now down about four standard deviations over 60 trading days, which is a far more dramatic decline than we saw in 1998, when Russia endured a currency crisis and the collapse of the hedge fund Long-Term Capital Management threatened the global financial sector, and in 2001 after the September 11 terror attacks.
The S&P 100 Index was down 7 percent in November, while the S&P SmallCap 600 Index recorded a 12 percent loss in the month. This is consistent with the U-shaped bottom that we expect. It's also an important reminder that different sectors, commodities and countries will bottom out at different times.
On top of these other factors, mortgage rates fell the better part of a percentage point last week after the Federal Reserve said that it would buy up to $600 billion in debt. This is a massive liquidity injection that in the next six to nine months could have a positive impact on commodity and equity prices.
Gold— November was a very good month for gold. In fact, it was the best month in nearly a decade. Gold for December delivery was up 3 percent for the week and 14 percent for the month, the biggest one-month gain since September 1999. We believe the dollar is overvalued and due for a correction, which stands to be good for gold as a safe store of wealth.
Gold equities— With their expense structure improving due to lower energy, commodities and labor costs, the miners are positioned to see more benefit from a rising gold price. The Philadelphia Gold and Silver Index (XAU) rose nearly 25 percent in the month of November. Kinross Gold recently bought a Chilean property with gold resources estimated at 5.4 million ounces, signaling that the financially healthy miners could get back into the acquisitions business, and recent offerings by Agnico-Eagle Mines and Red Back Mining have been well-received by the market. The junior miners remain bogged down by liquidity issues and tax-loss selling, and this may be continue to be a drag on performance for the next month.
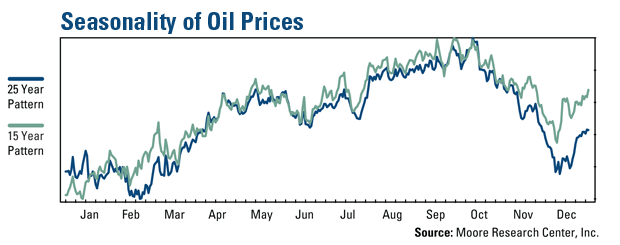
Oil— The long-term seasonal chart for crude oil shows that prices tend to fall off in September through November before bouncing back in December as we head into the winter heating period. Above is a chart showing the monthly price change for oil over the past 15 years and the past 25 years, and you can see that the pattern is consistent.
The seasonally weak demand period overlapped with most of the steep price decline from the peak of near $150 per barrel in July, giving some credence to the validity of this long-term trend and supporting the possibility of a December rally. Gasoline is selling for less than half of where it was just a few short months ago—these cheaper prices at the pump are tantamount to a $150 billion tax cut for Americans, which stands to be a benefit going into the holiday season.
Bonds, stocks and commodities have sold off sharply as a result of global de-leveraging and slowing economic conditions. These negative demand data points coincided with the seasonally weak period for crude oil, resulting in a 67 percent decline in crude oil from July highs to the lows below $50 per barrel in late November. If the seasonal patterns shown on the chart hold, we may see a sustained rally in crude oil heading into the spring of 2009.
Emerging Markets— Like the S&P 500, the MSCI Emerging Markets Index was more oversold during the current market downturn than it was in the late 1990s, when emerging markets were hit hard by currency crises in Asia and in Russia .
As we've said previously, emerging market stocks have strong fundamentals and they are trading at attractively low price/earnings multiples. On a macro level, many of these nations are holding vast quantities of dollars and other foreign reserves. China , with an estimated $2 trillion in reserves, has been more aggressive in its effort to maintain strong GDP growth than any other government. Last week the Beijing government cut interest rates by 1.08 percent—that's the equivalent of four normal rate cuts—and it has taken other significant steps to encourage banks to lend money and citizens to buy homes. Now that's commitment.
The possible turnaround that we are seeing is not wishful thinking, but it's not a sure thing, either. Our confidence grows, however, with every positive data point indicating that a reversal is near.
By Frank Holmes, CEO , U.S. Global Investors
Frank Holmes is CEO and chief investment officer at U.S. Global Investors , a Texas-based investment adviser that specializes in natural resources, emerging markets and global infrastructure. The company's 13 mutual funds include the Global Resources Fund (PSPFX) , Gold and Precious Metals Fund (USERX) and Global MegaTrends Fund (MEGAX) .
More timely commentary from Frank Holmes is available in his investment blog, “Frank Talk”: www.usfunds.com/franktalk .
Please consider carefully the fund's investment objectives, risks, charges and expenses. For this and other important information, obtain a fund prospectus by visiting www.usfunds.com or by calling 1-800-US-FUNDS (1-800-873-8637). Read it carefully before investing. Distributed by U.S. Global Brokerage, Inc.
All opinions expressed and data provided are subject to change without notice. Some of these opinions may not be appropriate to every investor. Gold funds may be susceptible to adverse economic, political or regulatory developments due to concentrating in a single theme. The price of gold is subject to substantial price fluctuations over short periods of time and may be affected by unpredicted international monetary and political policies. We suggest investing no more than 5% to 10% of your portfolio in gold or gold stocks. The following securities mentioned in the article were held by one or more of U.S. Global Investors family of funds as of 12-31-07 : streetTRACKS Gold Trust.
Frank Holmes Archive |
© 2005-2022 http://www.MarketOracle.co.uk - The Market Oracle is a FREE Daily Financial Markets Analysis & Forecasting online publication.