


Stocks & Commodity Markets Elliott Wave Analysis - Future's So Bright !
Stock-Markets / Elliott Wave Theory Apr 15, 2007 - 07:04 PM GMTBy: Dominick

Since I didn't write an update last week, I will go back to the April 1 st update to review where we had left off. In that update I had stated:
“This week, we might have the same situation, but on a smaller degree. Has the market topped out in a second wave retracement on March 23rd, or are we about to set a huge bear trap to finally get that run to new highs that sets up the classic capitulation?
As we've basically nailed these last two swings, we think we have the correct possible patterns and are waiting for a bit more price action to confirm. It might only take another day or two. I believe we will have a decent move within the next 20 points that we are ready to trade.”
As I argued in that update, traders took it for granted that the top was in and they traded and counted it as such. Instead, I had seen the drop from February as a 3 wave correction right into the promised 1360 level. Traders who missed last year's rally wanted to make it up on a 1987-style crash. Unfortunately for them, if you already have a bias, the market can and will dance circles around you.
And that's what it did to many. Most of our new members had to be cautioned right away about adopting the silly crash counts off the March lows. They must be pretty happy now, because emails continue to flood in, thanking me about the “unbiased” style of trading espoused by TTC.
If you missed it, we continued to shine these past two weeks as the same bear trap we've seen for five years again played out. This is the move when the market grinds up to a high it can't sustain, rolls over, and sets up another trap for the bulls to squeeze the bears. Not only did we sense it happening, but the bottom was only 4 points off the famous 1360 level!
So, as everyone continued to move their bearish wave 2 label farther and farther north each day with the market's advances, we were buying the dips instead. If you remember, we bought that selloff into SPX 1408, two weeks ago. That was the low of that swing. How corrective selloffs become impulsive moves to some traders is beyond me. That move was so corrective, it wasn't funny.
From that low, the market immediately started to advance and gap. For several weeks we had a target for the S&P futures of 1452.50 and we got there. And don't forget the April 9 th turn date. The market pretty much delivered both at the same time. (#1 on the chart below). It didn't turn out to be a big turn at all, but blame that to the short covering.
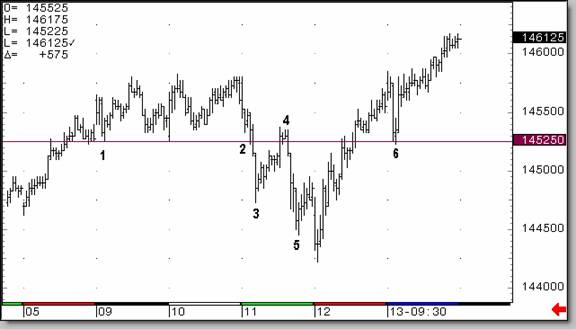
Also notice that the correction we got this week was initiated from that 1452.50 level (#2). Scary eh? It even went back there just before the Fed minutes on Wednesday afternoon only to find resistance (#4). We enjoyed trading that day since we had targets of 1447 and 1425. The morning's low was 1447.25 (#3) and the afternoon low was 1444.50(5), after finding resistance at 1452.50 in between (#4). Notice that Friday's low retested the 52.50 area before rallying again (#6), another easy trade.
Closing Wednesday at 1449 looked good but before calling it a day, I posted this chart at midnight as something didn't feel right about the bounce.
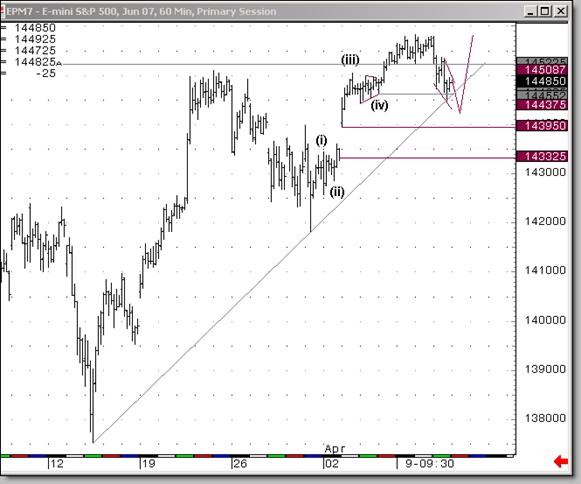
Thursday morning the futures were down 2.5 points in globex and members logging in the morning, or during the night from overseas, knew to expect a lower low that would trap many traders in the morning. Traders were again trapped into a short position as they only had the gap to focus on. I posted this chart pre-market:
The perfect target was 1442.25 and the market delivered EXACTLY that. The low of that move was 1442.25! If the market had decided not to obey, our risk was already shown in the chart, being only 3.25 points. At 1440 the pattern would have been wrong. So, a 3.25 point risk and the futures closed at 1461 on Friday. Sounds like a plan to me.
Many new members join expecting to get the traditional “buy here”, “sell here” calls from a stale weekly update. After explaining that I never started the site to do that, but rather teach them where the market is telling them to place entries and stops, 98% stay and love it. They find out very early that learning what the market is saying and having updates 24/7 works, otherwise they wouldn't be staying. Thursday's setup shown in the updated chart below clearly shows that logic works!
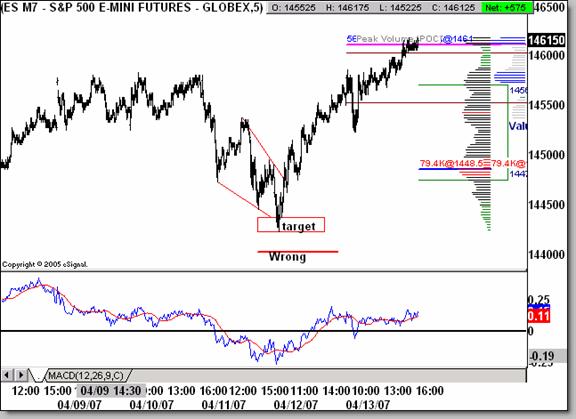
From that low, the market grinded up 15 points on Thursday leaving traders to try and short it the whole way up. Then on Friday morning it gave the shorts yet another head fake by selling off to where? 1452.50. That was an easy trade since we had the exact level and also mentioned it in realtime in the chatroom. A boring trade on Friday, but buying 1452.50 and not shorting a rising market fits us just fine.
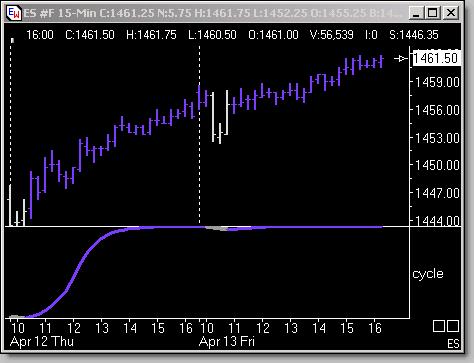
In fact, we were not even able to short on Friday, and what I mean by that is, the trend charts we are finding ourselves relying on so much didn't give us anything to hope for on the downside. Look at this 15min chart that refused to let us sell Friday, and it sure was correct considering we closed at the high tick. It also had popped off the lows on Thursday to validate the pattern we had been looking for.
Basically, the last 2 weeks have been extremely easy for us as we saw through the bearish trap and leaned to the long side. Readers will also remember that I had set up a Dow Map at the March lows and said there were 3 bullish patterns vs. 1 bearish one. It paid to have those maps, especially if you followed the bullish ones the last few weeks as we updated our outlook in realtime and in the forums.
We are once again close to a very important juncture, so close that it could be only a few hours away. The map that led us here continues to work perfectly, so we will continue to follow it. If correct, we don't have much to do but make money.
Does the next move become the capitulation stage or once again the talk of a 3 rd of a 3 rd of a 3 rd ? We believe we know that answer. Bearish sentiment continues to fuel this rally as short traders are forced to cover on each upside surprise. I will be monitoring option sentiment at our nearby target next week. Our friend from Market clues, Bob Carver, has already posted his dollar weighted put/call ratios to the forum late Friday and they sure do agree with our thinking.
If you haven't made good profits this year, its time to really think about what you're doing wrong. Or should I say if you have watched or shorted a rally from the 2002 lows that has recovered all but 100 points of the its decline. If this is you, join now, become part of TTC, and get to understand why you are trading a certain side of the market and learn how to find the money. It's also a perfect time as we will be having a fee increase before the summer. Read below for details.
Europe
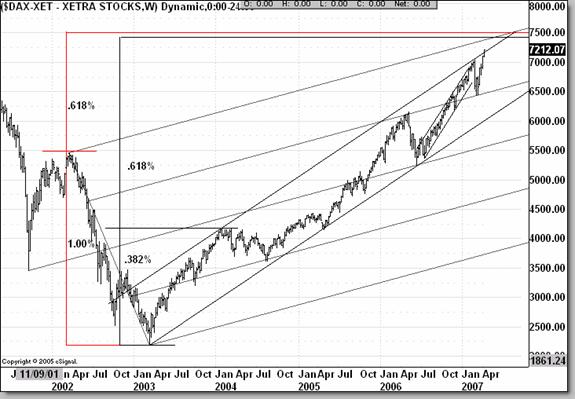
The Dax has been pulling us along their explosive ride the last few weeks. This is surely another index on our radar screen. We think we have the area it's targeting as shown in the chart below. If this is something you want to pay attention to, our members now have some trend charts on the Dax and FTSE to use on their intraday trading. And trust me, these charts have saved many traders that were always quick on the sell button.
Grains
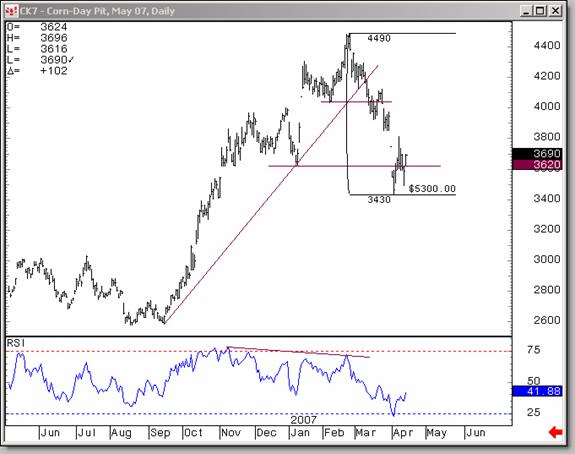
Remember the big grain idea we had for members? We then showed it in an update 2 weeks ago. While the media was pumping up the corn/ethanol idea, we were finding a spot to sell it. The results are below. It was an easy setup to capture a big part of the $5,300 from top to bottom in only 1 contract!!!!
Multiply that by 10 contracts and you have a $53,000 move. Still think the ES is the only thing to trade? Ideas like this are constantly posted to members. Imagine making this kind of money on a market you don't trade.
Softs
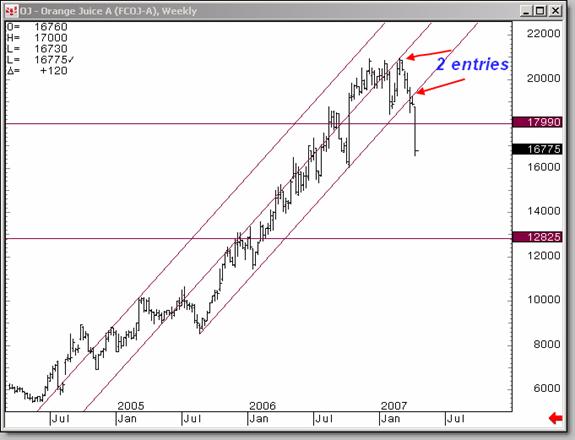
We did the same with orange juice. Some continue to believe in the fundamentals, I believe in Trading the Charts. The results are below.
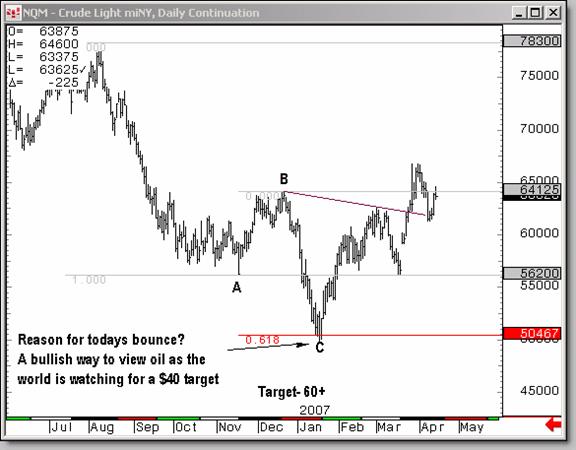
Oil
Oil was another big winner. Readers will remember that we bought it at $50 as the media had it going to $40 or even $30. In the last update, I stated this:
“Crude shot up to its highest levels since December this week. Remember when the talk was about oil in the $30's, except for me, who was telling you to expect mid $60's again? Well, here we are. No doubt some buyers were getting in this week on the news coming out of Iran . While this situation can honestly go either way from here, it'll probably be awhile before any new escalations, so there's a good chance oil settles back down a bit.”
The results are below
Gold
Precious metals have been popular with the “in-crowd”… the inflation crowd that is! With confidence returning to the global economy and inflation continuing to keep the Fed out of its comfort zone, gold is back above $680 and looking to tangle with the February highs. Be sure to read Joe's Precious Points update for more on this evolving market.
Members only
After a terrific week, we continue to fire on all cylinders and next week won't be any different. Most of you have my ideas for next week from our chats in the chatroom. If not, be sure to check all the updated charts this weekend as the next two weeks should be very volatile. We know chart # 1 and #2 are working perfectly and what's nice is they both have the same short term setups going forward.
Below are the Dow maps we have been tracking.
To Current and Prospective Members:
TTC will be increasing it monthly subscription fee sometime before this summer. The increase has become inevitable due to our ongoing expansion of the Website, computer and software upgrades, and the addition of services such as trend cycle charts. Current members and anyone that joins before the increase takes effect will not be subject to the new price, and will continue paying the current $50 subscription fee on a month-to-month basis. So if you have been thinking of joining, this might be a great time.
Thank you for your attention to these changes. If there are any questions, please direct your email to admin@tradingthecharts.com .
Have a profitable and safe week trading, and remember:
“Unbiased Elliott Wave works!”
For real-time analysis, become a member for only $50
If you've enjoyed this article, signup for Market Updates , our monthly newsletter, and, for more immediate analysis and market reaction, view my work and the charts exchanged between our seasoned traders in TradingtheCharts forum . Continued success has inspired expansion of the “open access to non subscribers” forums, and our Market Advisory members and I have agreed to post our work in these forums periodically. Explore services from Wall Street's best, including Jim Curry, Tim Ords, Glen Neely, Richard Rhodes, Andre Gratian, Bob Carver, Eric Hadik, Chartsedge, Elliott today, Stock Barometer, Harry Boxer, Mike Paulenoff and others. Try them all, subscribe to the ones that suit your style, and accelerate your trading profits! These forums are on the top of the homepage at Trading the Charts. Market analysts are always welcome to contribute to the Forum or newsletter. Email me @ Dominick@tradingthecharts.com if you have any interest.
This update is provided as general information and is not an investment recommendation. TTC accepts no liability whatsoever for any losses resulting from action taken based on the contents of its charts, commentaries, or price data. Securities and commodities markets involve inherent risk and not all positions are suitable for each individual. Check with your licensed financial advisor or broker prior to taking any action.
© 2005-2022 http://www.MarketOracle.co.uk - The Market Oracle is a FREE Daily Financial Markets Analysis & Forecasting online publication.