


US Stock Market Cycle Turning Points
Stock-Markets / Cycles Analysis Apr 23, 2007 - 03:57 PM GMTBy: Andre_Gratian

A 3-dimensional approach to technical analysis
Cycles - Breadth - Price projections
"By the Law of Periodical Repetition, everything which has happened once must happen again, and again, and again -- and not capriciously, but at regular periods, and each thing in its own period, not another's, and each obeying its own law... The same Nature which delights in periodical repetition in the sky is the Nature which orders the affairs of the earth. Let us not underrate the value of that hint." -- Mark Twain
Current Position of the Market.
SPX: Long-Term Trend - The 12-year and 10-year cycles are still in their up-phases but their influence will be reduced in the weeks ahead as intermediate and long term cycles bear down into year-end.
SPX: Intermediate Trend - The intermediate-term correction came to an end on 3/14 with the bottoming of the 20-week cycle. The trend is still up, but could be challenged over the next few weeks.
Analysis of the short-term trend is done on a daily basis with the help of hourly charts. It is an important adjunct to the analysis of daily and weekly charts which determines the course of longer market trends.
Daily market analysis of the short term trend is reserved for subscribers. If you would like to sign up for a FREE 4-week trial period of daily comments, please let me know at ajg@cybertrails.com .
Overview
The market strength of last week has pushed all of the major indices beyond their February tops to new bull market highs, with the big caps outperforming the small caps and the techs. The Russell 2000 barely eked out a new high last Monday and clearly under-performed for the rest of the week. The Nasdaq caught up with the rest of the pack on Friday, but closed below its February high. Since these indices tend to lead the market, their underperformance could have some significance, especially since it is occurring during a time frame when we are looking for an intermediate market top, but we will need more time to see if the laggards are really flashing an early warning.
The Dow Jones Transportation index also managed to make a marginal new high, probably delighting the long-term bulls who rely on the Dow Theory. With both the Industrials and the Transportation indices making new highs, according to this theory we are still in a bull market.
What's Ahead?
Cycles
In the last newsletter, I wrote the following:
The last 20-week cycle reached its high point in late February, only two weeks before its low of 3/14. This is an indication that the longer term trend is still healthy and the rally since the low has proved it. The three cycles that lay ahead of that date -- the 9-week, 6-week and 9-mo (all of which were collectively scheduled to bring a correction into mid-April) -- were expected to provide the conditions for a test of the lows before the uptrend could resume, but this test has taken the form of a brief interruption in the uptrend. With the 9-week now out of the way, the 6-week and 9-mo are only expected to bring about another short-term pull-back, and then it will be clear sailing to new bull market highs.
I believe that the stock market has demonstrated the accuracy of this forecast by its recent action. The SPX and the major market indices did successfully overcome the downward pressure brought by short-term cycles in March and April. Even the 9-mo cycle, whose low can now be placed at the end of March, had little effect on the uptrend which began with the bottoming of the 20-week cycle in mid- March.
The next significant challenge will come from the 10-week cycle which is due to bottom in mid-May. How much weakness it can generate and better yet, how much strength it can demonstrate after it has made its low will give us some important insights into the viability of the on-going intermediate and long-term trends.
More important cycles will soon come into play, in particular the 4 ½-yr cycle which is due to bottom about July/August in conjunction with the 9/18-mo cycle. Remember that there are two apparent 9- mo cycles. The one which just made its low recently should probably be called the 9-mo alternate. The one which will bottom in July/August belongs to a different series. This time period will also see the next 20-week cycle low, which is the 80-week low of that series, as well.
The 12-year cycle which caused the sharp drop into the October 2002 low has two important subdivision components: the 2-year and the 3-year cycles. These cycles played an important part in providing the recent market strength, but they are now in the process of topping and should soon begin to reverse course. It would not be surprising if the market, deprived of two of its bullish engines, began to do the same. The nest of cycles making their lows in late Summer could cause the first serious challenge to the bull market and if a significant correction takes place, the indices may have some difficulty resuming their long-term uptrend.
Technical Indicators:
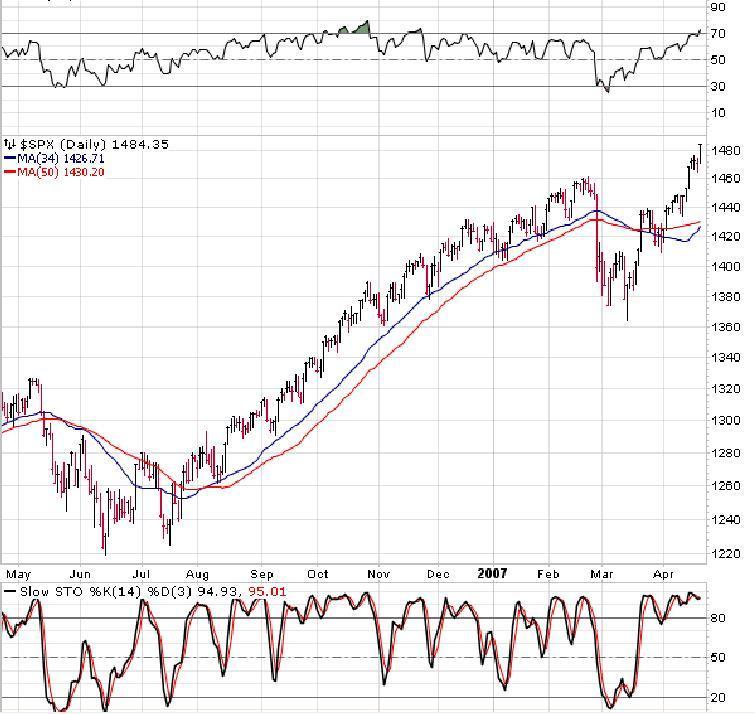
Looking at the daily chart of the SPX (courtesy of Stockcharts), the only negative thing that can be said for this market is that it is probably in need of a correction. The RSI and the stochastics are both overbought, but they do not show any negative divergence. This cannot be said of the breadth and weekly indicators which are beginning to suggest that there is trouble ahead. But for now, at least, there is no sign of price deceleration.
Projections
We can already project that the next intermediate-term high for the SPX -- which could also prove to be the bull market high -- will be between 1498 and 1520. These are levels to keep in mind as we approach them. They have been determined by Fibonacci measurements, but there is at least one Point & Figure count from the base which projects to 1498.
This was stated in the last newsletter and there is no cause to change it at this time. However, since it is unlikely that we will progress to these levels straight away, we should look for stopping points along the road where the market can catch its breath. With the SPX touching 1484 on Friday, we may be at or near one right now. Short-term Fibonacci projections established a target zone between 1478 and 1485 which is reinforced by a Point and Figure count taken from a re-accumulation level to about 1485. These projections are not written in stone, but they prove to be extremely accurate the majority of the time.
Breadth
The longer-term picture of the McClellan summation index is not very bullish. It made its high in January 2007 and has made a succession of lower highs and lower lows since then. It is currently in an uptrend which matches the price pattern since 3/14, but the odds that it will overcome its former high are not very good. If it fails to do so, it will be flashing a warning that we are approaching an important top. There is no reason to change this analysis either. If anything, the summation index looks a little worse than it did a couple of weeks ago (especially that of the Nasdaq), and the McClellan oscillator is flashing warning signs for the short-term.
Market leaders
Last week, the NDX made a feeble attempt at making a new high but failed to close above February's price while the SPX closed 23 points higher. This is the beginning of negative divergence. The same thing happened with the RUTX (Russell 2000). These are not conclusive signs that we are at a top, but they constitute at least a warning, and when you add to that the performance of GE and XBD , it's time to start paying attention.
Volatility
Last week, I read comments made by Jake Bernstein about volatility. He believes that it is the result of electronic trading and the reduced influence of the pit and floor broker which has increased the ability to transact trades within seconds. This has increased participation and decreased the time frame within which traders conduct their business, leading to the increasing frequency and magnitude of price swings.
The rapid dissemination of political and economic news via the internet has had a profound and immediate effect on market participants. These "knee jerk" reactions are meaningless in the long run, but explosive in the short run. It has benefited the traders who have confidence in their methods, discipline and experience, and places the small investor who thinks that the market is "easy", at a greater disadvantage.
Summary
The intermediate term trend which began on March 14 is expected to continue for a little longer, but it may have reached a speed bump in the vicinity of 1485. The next two or three weeks are now critical in assessing the possibility of an intermediate-term top, and perhaps a top to the bull market as well.
By Andre Gratian
MarketTurningPoints.com
If this information is of value to you, you should consider our trial subscription offer (above). Daily updates consist of a
Morning Comment, Closing Comment (which occasionally includes an updated hourly chart of the SPX to illustrate the
analysis), and at least one or more updates during the trading session whenever it is warranted by market action. These
updates discuss phase completions, give projections, potential reversal points, and whatever else may be pertinent to the
short-term trend.
You may also want to visit the Market Turning Points website to familiarize yourself with my philosophy and strategy.www.marketurningpoints.com
Disclaimer - The above comments about the financial markets are based purely on what I consider to be sound technical analysis principles uncompromised by fundamental considerations. They represent my own opinion and are not meant to be construed as trading or investment advice, but are offered as an analytical point of view which might be of interest to those who follow stock market cycles and technical analysis.
© 2005-2022 http://www.MarketOracle.co.uk - The Market Oracle is a FREE Daily Financial Markets Analysis & Forecasting online publication.