


S&P 500 Index Demand Power and Supply Pressure Buy and Sell Entry and Exit Signal
Stock-Markets / US Stock Markets Apr 24, 2007 - 11:36 AM GMT
 We've been measuring and reporting Demand Power and Supply Pressure for the Blue Chip indices each night for several years. This week we present them graphically, and show you how they offer highly correlative buy and sell signals. But even more exciting, for those of you who have been wanting some guidance on exit signals, these indicators also offer an option for exiting an established position.
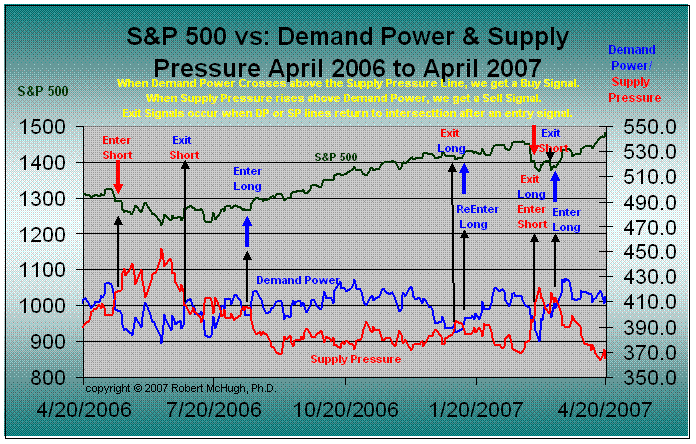
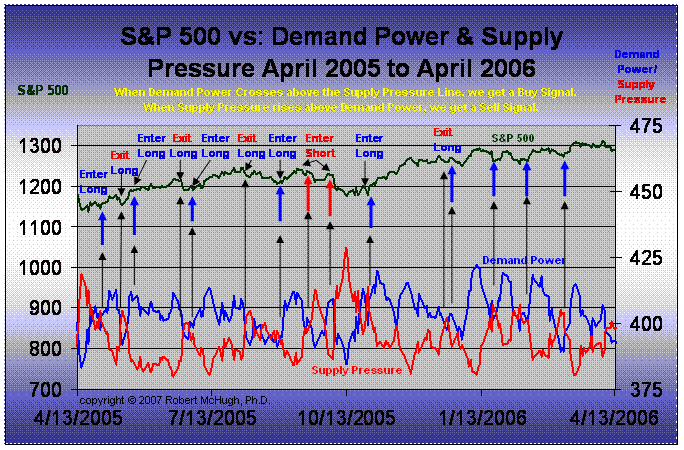
What is Demand Power and Supply Pressure? They are our proprietary measures of buying interest and selling interest. They are the raw components of our highly correlative Purchasing Power Indicator. Like most of our key trend-finder indicators, they are momentum measures . We believe the best tool to find a trend of 2 percent or more is by following momentum measures. By breaking down the Purchasing Power Indicator into its two key components, we end up with a trading system that identifies 1) when we can enter on the long side (buy the market, with either cash market purchases, futures, or call options), 2) when we should exit that long position, 3) when we can enter on the short side (play the market to decline with an inverse Rydex fund, or futures, or put options), and 4) when it would be wise to close that short position. There are never guarantees in this business, however, a look at the above chart, and the chart from two years ago that follows, shows that our odds are pretty good with this system.
One thing I really like about this trading system is that it will very rarely leave us holding a short position when we shouldn't. A lot of money has been lost on the short side over the past two years due to the Plunge Protection Team's increasing market intervention , where they take advantage of heavy short positions, initiating surprise rallies, or sustain rallies indefinitely. By focusing on buying interest and selling interest momentum, we can know that even though an Elliott Wave labeling is calling for a top, one may not be coming quite yet if Demand Power is dominating Supply Pressure, thereby guiding us to hold off from entering a short position too soon.
So how do we use this market timing trading system? It is simple. The blue line represents Demand Power. The red line represents Supply Pressure . Simply, whenever the Blue line crosses above the red line, the odds are very high that a rising trend is starting. So we enter a long position on the date the Blue crosses over the red line. If we want to be conservative, we can wait for a decisive crossing before taking a position. One might consider that to be where Demand Power rises more than 10 points above the Supply Pressure reading. We present these measures every night as part of our daily market updates, and include them on page 2 of each report at www.technicalindicatorindex.com .
Once the Blue line rises above the red line, we hold our long position. We can always exit at any time, especially if we have a profit we are satisfied with. However if we want to try and get the maximum out of a move, we can hold that position until the blue line drops down and intersects the red line again. That would be the latest time we would close the long position. Most of the time, the trend has not reversed when these two lines intersect, or if it has reversed, only a small portion of the reversal has taken place. Sometimes the intersection does not mean a new reversal of trend, but merely means a sideways move is coming, thus if we are holding options (where sideways moves are death), we can get out before too much time decay steals from our paper profit.
Should the red line (supply pressure) rise decisively above the blue line, we would consider that an entry signal to take a short position, if so inclined . We could buy put options at that point. We would then hold that position until the red line returns to intersect again with the Blue (Demand Power), at which time we want to get out of our short position if we haven't taken a profit and gotten out by then.
Another interesting dynamic of this market-timing trading system is that if the Demand Power line (Blue) is above the Supply Pressure line (red), its measure can actually be dropping, yet the rising price trend it forecast will continue. This would be your classic early warning divergence against price. The trend usually stops when the two lines intersect, and is not correlative to whether Demand Power orSupply pressure is rising or falling, per se. In other words, once Demand Power rises above Supply Pressure, even if Demand Power is in a declining trend, the price trend will still likely rise until the two lines intersect. Conversely, once Supply Pressure is above Demand Power, even if it starts declining, the trend will likely remain down until the two lines intersect. Not always, but most of the time.
Why? Because if Supply Pressure and Demand Power are both declining, however Supply Pressure is dropping more than Demand Power is falling, then prices will float higher. Same on the reverse. If Supply Pressure is falling, but Demand Power is falling more steeply, prices will decline.
It is virtually impossible to catch a trend's life expectancy without a detailed analysis of Demand Power and Supply Pressure. We provide this information every night . We have a formula that considers each day's data, and convert that to Demand Power and Supply Pressure measures. We consider price in these calculations, but as or more importantly, we also consider other data, and the momentum change of that data. In combination, these determine Demand and Supply on any given day.
If you study the above chart, you'll see that our last two Trader's Corner transactions followed these signals, both entries and exits, the first one was a long position, the second one a short position. We realized a 35 percent profit on the December to January “long” trade, and realized a 41 percent profit on the March “short” trade. These indicators look to offer about 4 to 10 high probability trades per year, but those trades should be sweet.
In addition to the raw DP and SP statistic measures reported daily, we present this chart on a regular basis in the expanded weekend newsletters, to help subscribers improve their market timing trading and investing strategies, and become more profitable.
As far as the current analysis, The Demand Power line is far above the Supply Pressure line, suggesting this rally has more upside . That doesn't mean there might be a minor decline here or there, but the rising trend that started in late March looks to have further to go. That could change if we were to suddenly see two or three days of huge declining Demand and rising Supply, but as of now, there is still plenty of Demand out there to sustain this rally.
Again, as stated many times in the past, any body of technical work we present, that is not one of our key trend-finder indicators, is simply background. We do not trade off cycles, analogs, Elliott Wave analysis, patterns, moving averages, or Dow Theory. We trade off our momentum key trend-finder indicators of demand and supply (the Demand Power/Supply Pressure, and Purchasing Power Indicators), and off of breadth momentum (the 30 day and 14 day Stochastic indicators, and the Advance/Decline Line indicators). We are growing more confident in our PPT (Plunge Protection Team) Indicator and would consider it for trading purposes if it lines up with our other key trend-finder measures. The Primary Trend Indicator ( we show this once per month at the end of each month) gives us the long-term background trend behind the shorter-term key trend-finder indicators, meaning profit optimization will come when we trade entry signals that are in the same direction as the primary trend, and less profitable trades will come when we follow a short-term entry signal going against the primary trend .
“Thus says the Lord, Cursed is the man who trusts in mankind
And makes flesh his strength, and whose heart turns
away from the Lord.
Blessed is the man who trusts in the Lord,
and whose trust is the Lord.
For he will be like a tree planted by the water,
That extends its roots by a stream,
and will not fear when the heat comes;
But its leaves will be green, and it will not be anxious
in a year of drought, nor cease to yield fruit.”
Jeremiah 17: 5, 7, 8
For a Free 30 day Trial Subscription , go to
www.technicalindicatorindex.com and click on the button
at the upper right of the Home Page.
by Robert McHugh, Ph.D.
technicalindicatorindex.com
If you would like a Free 30 day Trial Subscription , simply go to www.technicalindicatorindex.com , and click on the FREE Trial button at the upper right of the home page. A subscription gains you access to our buy/sell signals, our Market Analysis Newsletters, Traders Corner, our model Conservative Investment Portfolio, Guest Articles, and our Archives.
Robert McHugh Ph.D. is President and CEO of Main Line Investors, Inc., a registered investment advisor in the Commonwealth of Pennsylvania, and can be reached at www.technicalindicatorindex.com. The statements, opinions, buy and sell signals, and analyses presented in this newsletter are provided as a general information and education service only. Opinions, estimates, buy and sell signals, and probabilities expressed herein constitute the judgment of the author as of the date indicated and are subject to change without notice. Nothing contained in this newsletter is intended to be, nor shall it be construed as, investment advice, nor is it to be relied upon in making any investment or other decision. Prior to making any investment decision, you are advised to consult with your broker, investment advisor or other appropriate tax or financial professional to determine the suitability of any investment. Neither Main Line Investors, Inc. nor Robert D. McHugh, Jr., Ph.D. Editor shall be responsible or have any liability for investment decisions based upon, or the results obtained from, the information provided. Copyright 2007, Main Line Investors, Inc. All Rights Reserved.
© 2005-2022 http://www.MarketOracle.co.uk - The Market Oracle is a FREE Daily Financial Markets Analysis & Forecasting online publication.