


Weekly Gold and Silver Technical Analysis Report - 29h April 2007 - Technically Precious with Merv
Commodities / Gold & Silver Apr 29, 2007 - 12:20 PM GMTBy: Merv_Burak

Time to start wondering if this is the start of a new bear or just a normal correction after a several week advance. There are analysts on both sides.
GOLD : LONG TERM
That Merv's Composite Index of Precious Metals Indices shown last week must be on to something. The initial reaction from a previous high last week, making a potential double top, accelerated this week. It's still in a “no panic yet” zone but another week or two of this kind of action and who knows?
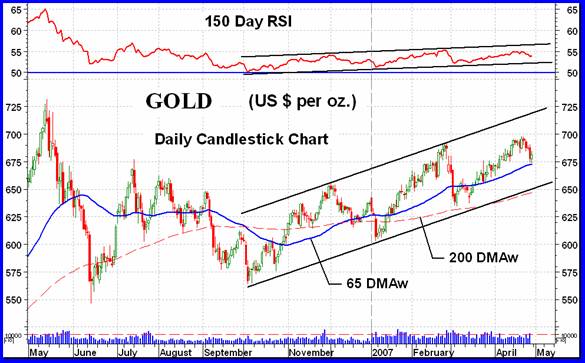
The long term P&F chart hasn't budget for two weeks now so I'll leave comments on it when something happens.
As for the bar (or candlestick) chart and the normal indicators, the reversal this past week is only a blip on the long term chart. Nothing to worry about – yet. However, one never knows when one of these blips just does not stop and becomes something more serious, so caution is always warranted.
As the chart shows, the action is still taking place well above a positively sloping long term moving average line with a long term momentum indicator that is still in its positive zone. The momentum has stayed positive throughout the past several months of questionable market direction. Since the bottom last October, while the price has had a nice run the momentum has not. It remained positive but only slightly so. The price has been approaching its previous high but the momentum has been far, far below its respective high. This negative divergence warning has to be corrected by either the price reversing or the momentum perking up. It looks like the price may be the one reversing but let's give it a little more time. Although we did have a negative week this action does not yet cause one to turn negative, long term wise. The indicators remain BULLISH.
INTERMEDIATE TERM
The recent action is almost in the middle of that long term up trending channel and sitting on top of a positive intermediate term moving average line. The intermediate term momentum indicator is tracing a path similar to the long term indicator, except with a little more up and down volatility. The short/intermediate term channel shown last week has been broken as expected, however this has not yet turned into a reversal intermediate term wise. It has caused one to be very, very cautious for the next while as the weakness could degenerate into something more serious. However, as the indicators are still all positive one remains in the BULLISH camp for the intermediate term but with one eye on the indicators for a possible reversal.
SHORT TERM
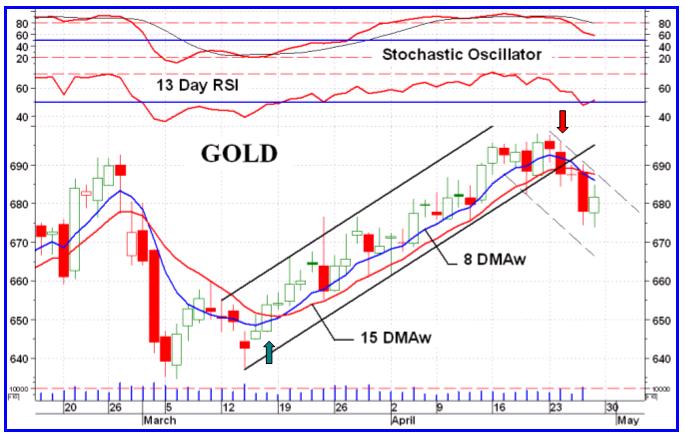
One thing all good momentum indicators do is to give one a warning of a possible turn around in the price direction by a weakening in the indicator ahead of the turn. You can see this in both the short term RSI and aggressive Stochastic Oscillator in the short term chart. As the price was making new highs a week ago both of these momentum indicators were warning that the strength of such price action was diminishing. Diminishing strength in a momentum indicator is always a good warning of a possible end of move or even a reversal of move. As often mentioned, nothing is perfect, so one would not jump to a conclusion but wait for a second confirmation of a turn by a break through the moving average or trend line or other confirmation. BUT one would be on guard for such reversal.
So, where are we heading, short term wise? It looks like the direction of least resistance is to the down side now, despite Friday's action. The action of the past few days has been below the short term moving average line and the line has now turned downwards. On Tuesday gold closed below the lower channel up trend line to confirm the message of the momentum indicator. As suggested last week (in the immediate term section) “watch out if it closes below $688.25”. It did so on Tuesday. Although the short term momentum indicator has been weakening for over a week it only went negative on Thursday but moved back into the positive on Friday. The absolute value is less important than the trend, and the trend is still towards lower levels. For now, the short term must be considered as BEARISH.
IMMEDIATE TERM
As mentioned last week, I'm not keeping track of the performance of the “flip of the coin” but it looks like it's working some times. So, this week what have we? It's the start of a new move, this one towards lower levels. The trend has not been established for any length of time so the coin flip is most important here. With the price below a negative very short term moving average line and the Stochastic Oscillator continuing on its downward path one can only go with a continuation of the trend. With only a few days of down side action it is difficult to determine a resistance trend line but for now the dashed lines are as good as any. These will most likely be revised as more trading action is on the chart. So, for the next couple of days the best guess would be a continuation of the down trend.
I'm not a futures trader nor a commodities expert but having followed the gold futures over many years one could do a lot worse than trade the futures according to the 8 day weighted moving average line shown in these short term charts. By using the turn around in the slope of the moving average line one is usually in during the major part of most moves, getting in early and out early (see arrows in the chart). Making use of the momentum indicators and one might have a good simple trading method here.
NORTH AMERICAN GOLD INDICES
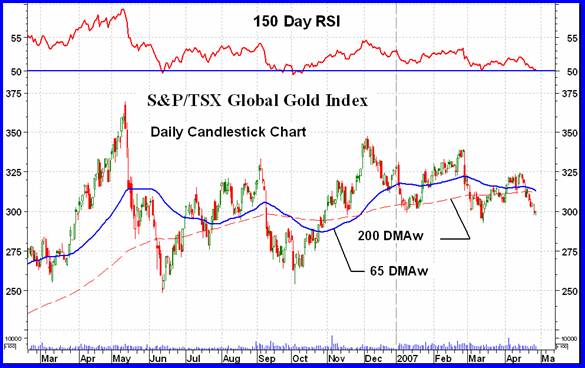
Here we are with the S&P/TSX Global Gold Index. Since the Index was revised to include US stocks and foreign stocks traded on the US markets there doesn't seem to be any great difference in the Index performance versus the other major Indices. It does appear to be a little weaker than the other majors, however. The major gold Indices, such as the S&P/TSX Global Gold Index, seem to be unsure where they want to go. They are weaker than gold itself but not so weak that they are going in a different direction. The recent action in this Index has been below its moving average lines and it might be telling us that more down side is still ahead. The long term momentum indicator is once more sitting on top of its neutral line. It dropped below the line twice in the past 11 months (June and October) but quickly recovered with the price going into a rally mode. Will it do so again? I doubt it. If the momentum drops below the neutral line this time I am inclined to think it will stay there for an extended period, but that remains to be seen. In the end these major Indices are a reflection of what the few very large gold stocks are up to and not necessarily what the gold stocks in general are doing. For that, see the Merv's Indices.
MERV'S PRECIOUS METALS INDICES
This has been a bad week for precious metal (gold & silver) stocks. The overall Composite of Precious Metals Indices declined 2.9% on the week. As mentioned earlier, the Composite Index hit a ceiling from its high of May 2006 and is now reacting lower. Unless the direction changes this has the makings of a double top pattern.
MERV'S GOLD & SILVER 160 INDEX
The top 100 North American traded stocks (in market value) along with 60 additional speculative stocks make up this Index. It represents the universe of precious metals stocks and is probably the best Index to understand what is happening to the overall precious metals stocks.
The Index declined 3.2% on the week, a little more than the Composite Index but that's the way it goes. The % decline does not tell the full story. There were almost 4 times as many declining stocks during the week as there were advancing stocks (76% decline, 20% advance). It was almost a slaughter. One good point was that the decliners were, in general, quite mild. There were no stocks in my plus/minus over 30% weekly performance category and only one in the over 20% range, and that one was a gainer. The decline has taken its toll on the ratings for the component stocks. Summing up the individual ratings, they all moved lower during the week. We are now at a 52% BEAR for the short term, NEUTRAL for the intermediate term and 63% BULL for the long term.
As for the normal indicators, they have changed very little during the week but all have deteriorated somewhat, as could be expected. The Index is still above its positive intermediate and long term moving average lines and the momentum indicators are still in their positive zone. For now there is still no worry about an imminent collapse of the gold stocks but one should never be too sure.
MERV'S QUAL-GOLD INDEX : MERV'S SPEC-GOLD INDEX : MERV'S GAMB-GOLD INDEX
This is probably the only place that you will find Sector Indices for gold stocks. I have taken the universe stocks and developed three sectors to represent the performances of the top quality stocks, the secondary stocks and the out and out gambling stocks. Each Index has 30 component stocks Whatever the overall universe might be doing it is here that you will understand which sector of the gold stocks are the ones moving, or not.
Last week we had a generally weak market with only the Gamb-Gold Index gaining during the week. This week all three sectors declined. The declines were what one might expect, the highest quality declining the least and the gambling stocks declining the most, although by only a fraction of a %. The Qual-Gold declined 2.7%, the Spec-Gold declined 2.8% and the Gamb-Gold declined 3.2%. This week's decline has taken the Qual-Gold Index below its previous May 2006 high level by 1.9%. The Spec-Gold Index is still 5.3% above its May 2006 high while the Gamb-Gold Index is still 19.7% above its May 2006 high. This is versus all of the major Indices still, on the average, 9.0% below their May 2006 highs.
As for the indicators, with a few exceptions the Indices are still above their positively sloping intermediate and long term moving average lines and their momentum indicators are in their positive zone. As for the exceptions, the Qual-Gold Index is now below its intermediate term moving average line and its intermediate term momentum is almost ready to drop below its neutral line. On the other hand the Gamb-Gold intermediate term momentum has been quite strong and inside its overbought zone. It has now moved below the overbought line for a trend reversal warning.
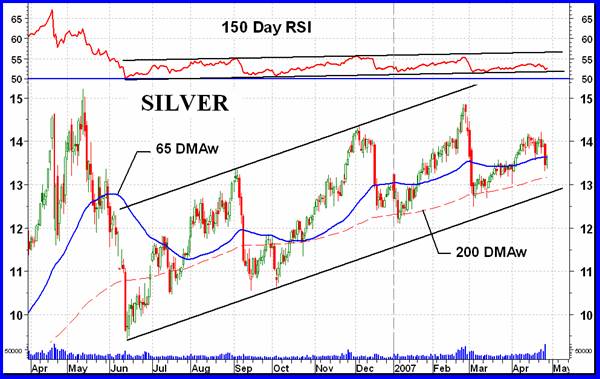
SILVER
Silver seems to be a metal that sometimes moves to its own drummer. For this reason I have developed two silver Indices, the Qual-Silver Index with 10 stocks represents the higher quality end of the silver stock spectrum while the Spec-Silver Index includes a mixture of everything else. For some time the silver sector had been acting superior to the actions of gold. Lately, however, silver seems to have lost some of its luster and is putting in a worse performance that that of gold. Noticeable is the action during April. The turn in gold this week was from a level higher than the previous top in February while the turn in silver was from a level considerably below its February top.
MERV'S QUAL-SILVER INDEX : MERV'S SPEC-SILVER INDEX
With the two silver sector Indices we have a reversal of the performance versus the gold sectors. Recently, the Qual-Silver has been out performing the Spec-Silver Index. This can be seen by the fact that although both are still above their May 2006 highs the Qual is 6.9% higher while the Spec is only 1.8% above the previous high. Both Indices are still above their intermediate and long term moving averages but in the case of the intermediate term, just barely above. The momentum indicators for both Indices are also still in their positive zones. Although the Indices seem to be getting weaker and weaker they are still in their BULLISH camp, but only slightly so. Any more decline and they risk turning bearish, especially on the intermediate term.
MERV'S PRECIOUS METALS INDICES TABLE
Well, that's it for this week.
By Merv Burak, CMT
Hudson Aero/Systems Inc.
Technical Information Group
for Merv's Precious Metals Central
Web: www.themarkettraders.com
e-mail: merv@themarkettraders.com
During the day Merv practices his engineering profession as a Consulting Aerospace Engineer. Once the sun goes down and night descends upon the earth Merv dons his other hat as a Chartered Market Technician ( CMT ) and tries to decipher what's going on in the securities markets. As an underground surveyor in the gold mines of Canada 's Northwest Territories in his youth, Merv has a soft spot for the gold industry and has developed several Gold Indices reflecting different aspects of the industry. As a basically lazy individual Merv's driving focus is to KEEP IT SIMPLE .
To find out more about Merv's various Gold Indices and component stocks, please visit www.themarkettraders.com and click on Merv's Precious Metals Central . There you will find samples of the Indices and their component stocks plus other publications of interest to gold investors. While at the themarkettraders.com web site please take the time to check out the Energy Central site and the various Merv's Energy Tables for the most comprehensive survey of energy stocks on the internet. Before you invest, Always check your market timing with a Qualified Professional Market Technician
© 2005-2022 http://www.MarketOracle.co.uk - The Market Oracle is a FREE Daily Financial Markets Analysis & Forecasting online publication.