


Brief Overview of Stock Market Cycles
Stock-Markets / Cycles Analysis Mar 07, 2009 - 12:56 PM GMTBy: Tim_Wood

 Of late, I have received a few e-mails about cycles and the ways in which I use them. I've learned that in many incidences it seems that when I talk about cycles many conjure up images of some sort of black magic, voodoo, chicken bones and the like. However, I can assure you that this is not the case and in this article I'll show you why. Cyclical analysis is simply a method of trend identification that allows one to look at various trends of like degree. In my case, I then data-mine these trends in an effort to find common traits.
In doing so, probabilities can then be applied to the various trends of the various degrees and I term this technique, “trend quantification.” I use technical indicators that I have developed to help me identify the various trends and their turn points. Then, I apply the applicable probabilities to current cyclical events in order to develop a forecast. These methods also have an added benefit in that they take the emotion out of the decision. What I mean is, this does not allow a belief that something is going to go up or down to taint the analysis. With this method, the probabilities are what they are and I simply follow them. My goal is just to get it right regardless of the direction.
The first dimension that I work in is the long-term. Please see the diagram below. The red trend lines are representative of the long-term cycle. The overall trend is obviously up when this cycle is advancing and is down when this cycle is declining. These lows are identified using statistics that have been developed over the years, the price action of each cycle of smaller degree and the help of price oscillators, mainly my Cycle Turn Indicator. Once a long-term cycle low is identified and confirmed, we then know that the trend is up. We can then use the declines into the lows of the cycles of smaller degree as buying opportunities. The opposite would of course be applicable when the long-term is moving down.
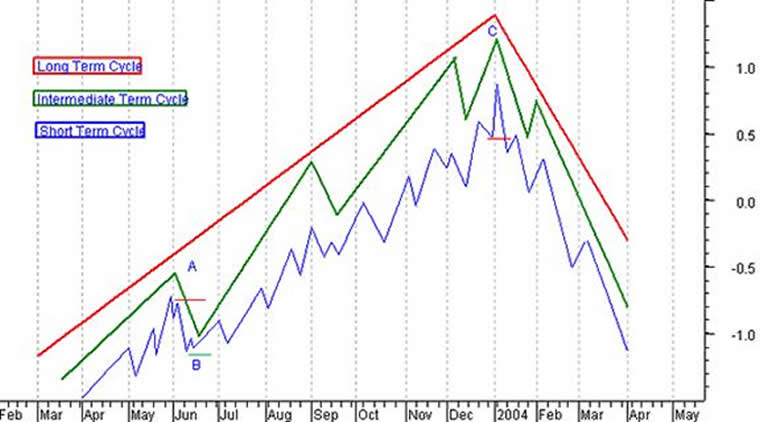
The second dimension in this example is the intermediate-term. This is represented by the green trend lines in the diagram above. We also have timing bands or windows in which the next low should occur. These timing bands are again developed and are based on the historical averages of the previous cycles of the same degree. This in effect gives us a time target from which to expect the next low. As this intermediate term cycle advances, we then monitor the price action of the short-term cycle, represented in blue, in order to identify possible tops and bottoms of the intermediate-term cycles. Plus, I use very specific indicators that I have developed to help identify these cyclical tops and bottoms.
The third dimension in this example is the short-term. This is represented by the blue trend lines in the diagram above. When working with the short-term cycles, there are also statistical based timing bands to help identify the time target for the next corrective move down. Notice that as this cycle moves up, each short-term cycle low is higher than the previous low. Also notice how each high is generally higher than the previous high. As long as this pattern holds, the trend is clearly up. The trick, which has taken years to develop, is the identification of which high and low marks THE cycle high or low and its meaning.
How The Three Dimensions Work Together
Notice at the first intermediate-term cycle top, labeled “ A ,” that the last short-term cycle failed to move above the previous short-term cycle high. I marked this event with a small red line. This setup is what I call a failure and this last occurred in the stock market on January 28 th . In doing so it warned of the decline that we are now seeing. In the case of the equity markets, the longer and intermediate-term trends were also down at the time of this failure. Anyway, getting back to this example, once the short-term cycle began to move down, notice that the previous short-term low was violated. This violation then serves as price confirmation that the intermediate-term cycle has topped. Therefore, the intermediate-term trend then turned down.
As a cycles analyst, I then look for the price action to continue down into the statistical based timing window for the next intermediate-term low. The price action of the short-term cycle is continuously monitored as the intermediate-term cycle moves down. I then use the combination of the timing window for the intermediate-term cycle low, the price action of the short-term cycle and my Cycle Turn Indicator to identify the next intermediate-term low.
Notice that at the intermediate-term low, labeled “ B, ” the short-term cycle makes a low above the previous low. This is sort of a failure in reverse, as price failed to make a lower low and was then followed by a higher high . This higher high is the final price confirmation that the intermediate-term trend has turned back up. At that point one can re-enter the long side or add to existing long positions as the long-term trend continues to advance. This analytical process is then repeated for the next intermediate-term cycle.
Let's now jump to the last intermediate-term advance. Notice how the intermediate-term cycle advance, labeled “ C, ” was brief in this example. Also, notice how the short-term cycle went parabolic into the final high. A similar example of this would be the top that occurred last July in the CRB and crude oil. Going back to the example above, there was no warning by the formation of a failed short-term cycle. However, in this case the cycles analyst would have known that the advance was running on borrowed time as his timing bands for the cycle top would have warned that the top was near. Then, when the short-term cycle went parabolic, he should have been further warned that the end was near for this cycle. However, in this example there was absolutely no cyclical deterioration until price fell below the previous short-term cycle low.
This event is marked with a small red line. Once the violation of the previous short-term low occurred, the cycles analyst should have known that the intermediate-term had topped. He should then have noted the warning, based upon the structure of the intermediate term cycle, that the long-term cycle had likely topped as well. Additionally, the short-term cycle has violated the previous short-term cycle low indicating that the intermediate-term cycle has topped and the price oscillators, particularly my Cycle Turn Indicator, should at this point be warning of imminent danger.
Then, with the break of the intermediate-term cycle below the previous intermediate-term cycle low, the confirmation is given that the long-term cycle has topped. Therefore, the turn in the long-term direction of the market has just occurred and that direction is now down. Once the long-term direction turns down. We can then expect to see both the intermediate-term and the short-term cycles make lower lows and lower highs all within the context what we refer to as left-translated cycles, which is another indication of the ongoing bearish environment that will continue in force until the long-term cycle low is reached.
Please understand that this is a VERY simple example of how I incorporate cycles into my overall technical analysis of the markets. Also please understand that this very simple diagram is an idealized example. In the real world no technical or fundamental approach is full proof. However, this is an approach that I have found to work. All we have to do is follow the Cycle Turn Indicator and work within the statistical based timing windows for price lows. For the benefit of new readers I will give you a couple of examples, sparing you the boring details, of how I have used these methods at longer-term market junctures. Back in 2000 I used these methods to call the stock market top and stated, based upon the probabilities, that the 4-year cycle low, which I said was due in 2002, would close below the 1998 4-year cycle low.As it turned out, this is exactly what happened.
As the market continued pressing higher into October 2007 I continuously stated emphatically that we were seeing an extended 4-year cycle. Based on the statistics I maintained that neither the July 2006 low nor the low in March 2007 were 4-year cycle lows and that the decline into the 4-year cycle low was still ahead of us. This has since proven correct as well. It was in October 2007 at the New Orleans Investor Conference that I first laid out the possibility of a 1930 to 1932 style event occurring as the current 4-year cycle failed and set itself up in the very bearish manner that has since come to pass. More recently, these same statistical methods were also used last summer to forecast the top seen in commodities and these methods specifically gave sell signals on the CRB, crude oil and gasoline the week of July 18, 2008.
So, point being, when cycles are properly interpreted and the appropriate indicators and statistics applied, they can be a very very important tool and they have nothing to do with black magic or voodoo. Cyclical analysis and trend quantification is simply an attempt of applying a scientific method to the markets that is non-emotional. Also understand that within the context of these longer-term trends, the same methods are used to identify intermediate and short-term trends and turn points as well.
As for the current case with equities, we are amidst a very similarly structured market to that of the 1930 to 1932 period just as I first warned about in October 2007 at the New Orleans Investor Conference. That being said, there will be bounces along the way and some of these bounces will be very flashy, tradable and very convincing affairs. As the market advances out of each of these bottoms the talking heads and clueless politicians will say that the low has been seen. We will probably hear that the Obama plan has begun to work and that the bear market is over.
Don't buy their hype. These guys never saw this problem coming in the first place, they don't understand that they can't fix it and they wouldn't know how to identify THE bottom if they had to. My approach is to work within the context of the Dow theory and the long-term cycles work as a backdrop. Then, use the intermediate and short-term Cycle Turn Indicator and statistics as tools to identify more meaningful bounces along the way. But, when you hear the mainstream guys on TV and the politicians telling you that the bear marked is over, change the channel and ask yourself this question. Did these guys warn me about the bear market in the first place? No, they did not. So, why would we think they would be able to identify the bottom? They can't! You have been warned!
I have begun doing free Friday market commentary that is available at www.cyclesman.info/Articles.htm so please begin joining me there. Should you be interested in more in depth analysis that provides intermediate-term turn points utilizing the Cycle Turn Indicator, which has done a fabulous job, on stock market, the dollar, bonds, gold, silver, oil, gasoline, and more, those details are available in the monthly research letter and short-term updates. We have called every turn in commodities, the dollar and the stock market. I have covering the details as to what's next with the stock market, the dollar and commodities with the latest in the October research letter and the short-term updates. Don't be fooled by the hype. A subscription includes access to the monthly issues of Cycles News & Views covering the Dow theory, and very detailed statistical based analysis plus updates 3 times a week. Also see www.cyclesman.info/testimonials.htm
By Tim Wood
Cyclesman.com
© 2009 Cycles News & Views; All Rights Reserved
Tim Wood specialises in Dow Theory and Cycles Analysis - Should you be interested in analysis that provides intermediate-term turn points utilizing the Cycle Turn Indicator as well as coverage on the Dow theory, other price quantification methods and all the statistical data surrounding the 4-year cycle, then please visit www.cyclesman.com for more details. A subscription includes access to the monthly issues of Cycles News & Views covering the stock market, the dollar, bonds and gold. I also cover other areas of interest at important turn points such as gasoline, oil, silver, the XAU and recently I have even covered corn. I also provide updates 3 times a week plus additional weekend updates on the Cycle Turn Indicator on most all areas of concern. I also give specific expectations for turn points of the short, intermediate and longer-term cycles based on historical quantification.
Tim Wood Archive |
© 2005-2022 http://www.MarketOracle.co.uk - The Market Oracle is a FREE Daily Financial Markets Analysis & Forecasting online publication.
Comments
|
TraderJoe
08 Mar 09, 00:54 |
4 year cycle
No comprende, your 4 year cycle low is now into its 7th year - http://www.marketoracle.co.uk/Article271.html |