


China's Stock Market, Tick, Tick, Tick ???
Stock-Markets / Chinese Stock Market May 07, 2007 - 03:55 PM GMTBy: Marty_Chenard

What the first thing you think of when you hear "tick, tick, tick"?
It could be a clock, but if you watched enough action films, it is usually a time bomb.
China tick #1: UBS's economist, Jonathan Anderson, was stunned when he calculated that China's Currency Reserves went up 1 million dollars a minute during the entire first quarter this year. " This is more than just a jump ," Anderson said in a report released yesterday. " The magnitude and the abruptness of this acceleration are simply stunning ."
China tick #2: At the same time, China's Central Bank Chief is apparently hearing a "tick, tick, tick". In a statement at a Switzerland Meeting this weekend, China's central bank chief admitted he is concerned about a stock market bubble in his country. (Double bubble, double trouble?)
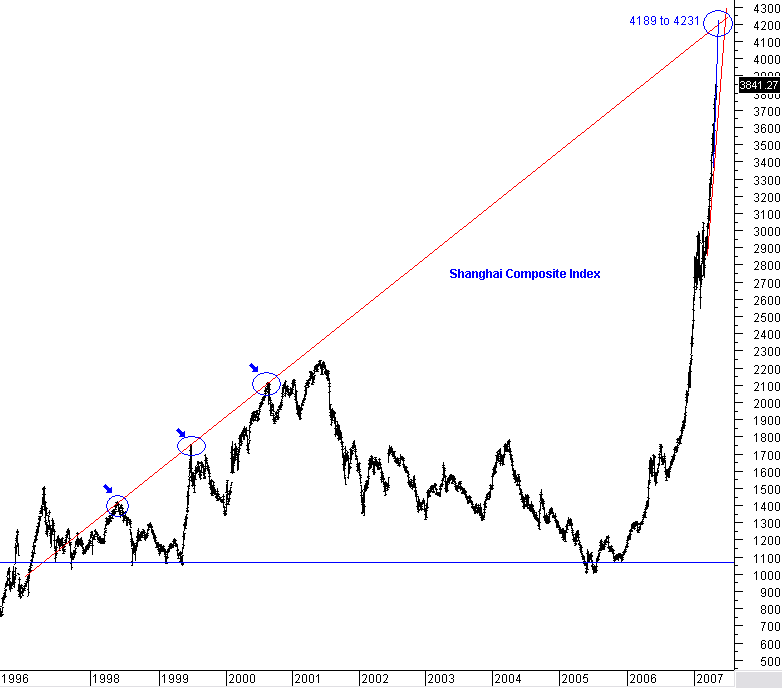
With that said, we will revisit China's Shanghai Composite which is now getting very close to a 12 year Major Resistance Point ... a level, that on the current parabolic trajectory will be reached sometime this month.
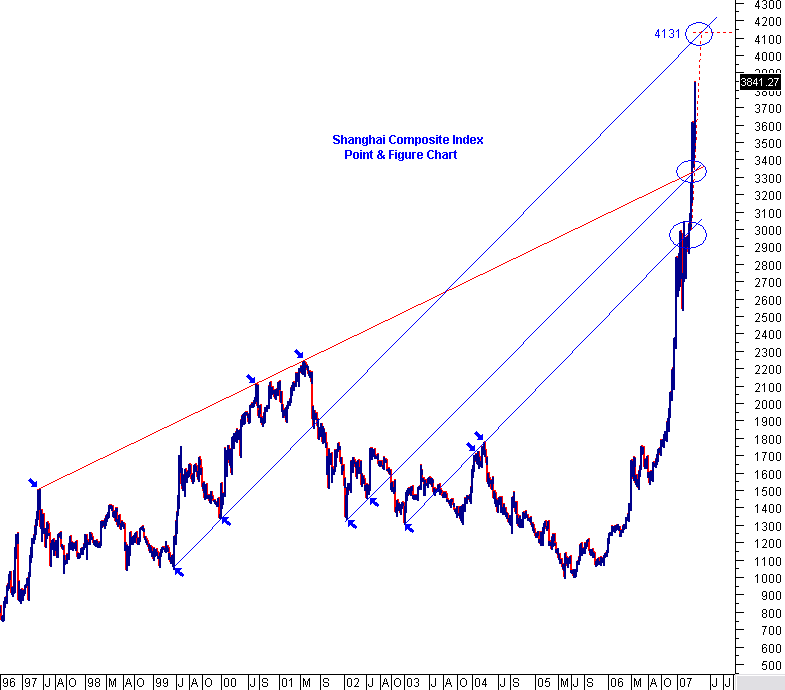
We have previously been looking at the Shanghai on a 12 year price chart, and this morning, we decided to also look at it on a Point & Figure chart. Point and Figure charts are valuable, because they take time out of the equation and look only at independent price movement.
The Shanghai Composite's Price Chart: The Shanghai is now only 7% away from its 12 year resistance line. The Shanghai has been closed for holidays, but will reopen tonight.
The Shanghai Composite Index has catapulted up in a parabolic trajectory that took it from 1180.96 in January of 2006 to 3841.27 before the holidays. That was a hefty 225.26% rise resulted in a hyper-parabolic rise that has the index going straight up ... and many think that there is no end in sight.
No end in sight? But, there is ... a very long, 12 year major resistance point will be reached, somewhere in between an index level of 4189 to 4231. Our internet bubble trajectory is being dwarfed by the speed and rise of the Shanghai Index.
The odds of a sharp reversal back down at that point is extremely high, because parabolic movements like this become exponentially more difficult as the trajectory's angle increases. This will also have a negative effect on the world wide markets, so keep an eye on this upcoming event.
Now .... see chart 2 for the Point & Figure chart ...
The Point & Figure Chart is quite interesting because it shows a different picture.
When you look at a Point & Figure chart, the Shanghai Composite has already broken through its 12 year resistance .
However, there is still an up coming 8 year resistance level that will also occur this month based on its current parabolic trajectory . That number is 4131, plus or minus about 100 points.
What could happen? The Shanghai could drop 1000 points in a very short period of time , and the world markets will not go unaffected.
Are there any other world wide indexes showing a problem?
Hedge Fund Manager, Peter Pierce, was kind enough to sent me an analysis of the India's BSE Index.
I don't have permission to show the charts, but the analysis showed an overlay of the index compared to our 1987 crash. The two charts were so similar, you couldn't tell which chart was which.
I know that many investors are euphoric and bad news doesn't mean much anymore, but there are some very definite "tick, tick, tick" noises being heard by many top analysts.
By Marty Chenard
http://www.stocktiming.com/
Please Note: We do not issue Buy or Sell timing recommendations on these Free daily update pages . I hope you understand, that in fairness, our Buy/Sell recommendations and advanced market Models are only available to our paid subscribers on a password required basis. Membership information
Marty Chenard is the Author and Teacher of two Seminar Courses on "Advanced Technical Analysis Investing", Mr. Chenard has been investing for over 30 years. In 2001 when the NASDAQ dropped 24.5%, his personal investment performance for the year was a gain of 57.428%. He is an Advanced Stock Market Technical Analyst that has developed his own proprietary analytical tools. As a result, he was out of the market two weeks before the 1987 Crash in the most recent Bear Market he faxed his Members in March 2000 telling them all to SELL. He is an advanced technical analyst and not an investment advisor, nor a securities broker.
© 2005-2022 http://www.MarketOracle.co.uk - The Market Oracle is a FREE Daily Financial Markets Analysis & Forecasting online publication.