


Weekly Stock Market Technical Analysis Report - 12th May 07
Stock-Markets / US Stock Markets May 12, 2007 - 11:58 AM GMTBy: Mike_Burk

The good news is: Most of the major indices hit multi year or all time highs last week.
Short Term
Most of the market run up since last summer has been marked by a lack of sellers not exuberant buyers. It looks like the sellers are returning.
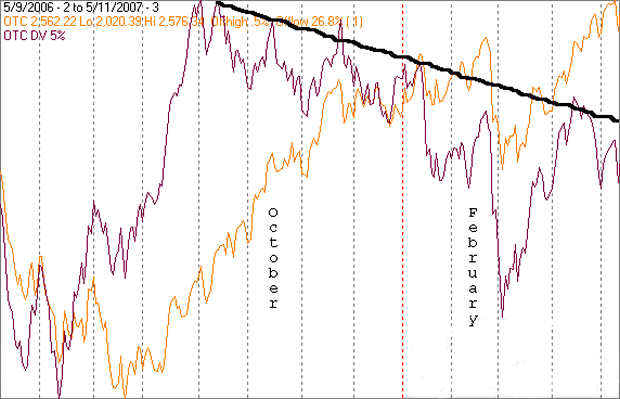
The chart below covers the past year showing the NASDAQ composite (OTC) in orange and a 5% trend (39 day EMA) of NASDAQ downside volume (OTC DV) in brown. OTC DV has been plotted on an inverted Y axis so decreasing downside volume moves the indicator upward (up is good).
OTC DV has been steadily increasing (the indicator has been moving downward) since its peak last September and the move appears to be accelerating.
Intermediate term
Market cycles can be defined by new lows.
From a bottom, new lows diminish quickly indicating a new upward move is beginning. New lows begin to increase near a top indicating support for the upward move is declining. Rules of thumb for NYSE and NASDAQ new lows suggest there should be little concern until NYSE new lows exceed 40 for several days and NASDAQ new lows exceed 70 for several days.
The chart below covers the past 9 months showing the NASDAQ composite (OTC) in orange and a10% trend (19 day EMA) of NASDAQ new lows (OTC NL) in grey. Like the first chart, OTC NL has been plotted on an inverted Y axis so decreasing new lows move the indicator upward. Dashed vertical lines have been drawn on the 1st trading day of each month, the line is red on the 1st trading day of the year.
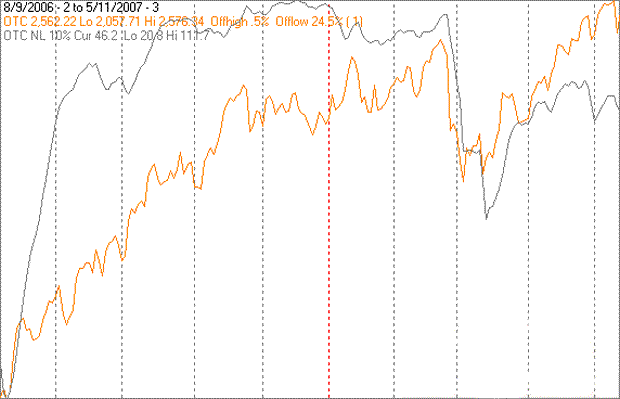
NASDAQ new lows exceeded 70 on the last day of April and 1st day of May, but have otherwise stayed below the threat threshold of 70. Still OTC NL has been trending downward (increasing new lows) since the 1st of this year.
Seasonality
Next week includes the 5 trading days ahead of the 3rd Friday of May during the 3rd year of the Presidential Cycle.
The tables below show the week ahead of the 3rd Friday in May for the OTC from 1963 - 2003 and the S&P500 (SPX) from 1955 - 2003 during the 3rd year of the Presidential Cycle. The market traded 6 days a week prior to 1953 so that data has been ignored.
There are summaries for both the 3rd year of the Presidential Cycle and all years combined.
Seasonally, next week has little to recommend it.
Both the OTC and SPX have been up less than 50% of the time and have had average negative returns. Over all years both indices have been up 50% of the time with the OTC average return slightly negative and the SPX average return slightly positive.
Report for the week before the 3rd Friday of May
The number following the year is the position in the presidential cycle.
Daily returns from Monday through 3rd Friday.
| OTC Presidential Year 3 | ||||||
| Year | Mon | Tue | Wed | Thur | Fri | Totals |
| 1963-3 | -0.06% | 0.09% | 0.06% | 0.18% | -0.06% | 0.21% |
| 1967-3 | -0.35% | -0.52% | 0.78% | 0.23% | 0.03% | 0.16% |
| 1971-3 | -1.44% | -0.69% | -0.06% | 0.36% | 0.12% | -1.71% |
| 1975-3 | -0.63% | 1.28% | -0.53% | -0.14% | -0.42% | -0.45% |
| 1979-3 | -0.54% | 0.02% | 0.26% | 0.84% | 0.44% | 1.02% |
| 1983-3 | -1.43% | 0.47% | 0.83% | -0.23% | 0.24% | -0.11% |
| Avg | -0.88% | 0.11% | 0.26% | 0.21% | 0.08% | -0.22% |
| 1987-3 | -0.24% | -0.39% | 0.33% | 0.18% | -0.89% | -1.01% |
| 1991-3 | 0.10% | -1.04% | -2.19% | 0.77% | -0.08% | -2.44% |
| 1995-3 | 0.48% | 0.60% | 0.42% | -0.90% | 0.06% | 0.66% |
| 1999-3 | 1.34% | -0.13% | 0.74% | -1.37% | -0.87% | -0.28% |
| 2003-3 | 1.40% | -0.11% | -0.31% | 1.07% | -0.83% | 1.22% |
| Avg | 0.62% | -0.21% | -0.20% | -0.05% | -0.52% | -0.37% |
| OTC summary for Presidential Year 3 1963 - 2003 | ||||||
| Avg | -0.12% | -0.04% | 0.03% | 0.09% | -0.21% | -0.25% |
| Win% | 36% | 45% | 64% | 64% | 45% | 45% |
| OTC summary for all years 1963 - 2006 | ||||||
| Avg | -0.03% | 0.09% | 0.09% | 0.04% | -0.26% | -0.08% |
| Win% | 48% | 48% | 59% | 52% | 42% | 50% |
| SPX Presidential Year 3 | ||||||
| Year | Mon | Tue | Wed | Thur | Fri | Totals |
| 1955-3 | -1.12% | -0.14% | 0.84% | 0.56% | 0.67% | 0.81% |
| 1959-3 | 0.42% | 0.16% | 0.56% | 0.69% | -0.36% | 1.46% |
| 1963-3 | -0.06% | -0.38% | 0.31% | -0.26% | 0.06% | -0.33% |
| 1967-3 | -0.82% | 0.46% | -0.39% | -0.27% | -0.50% | -1.51% |
| 1971-3 | -1.49% | 0.14% | 0.24% | 0.24% | -0.32% | -1.19% |
| 1975-3 | 0.09% | 1.07% | 0.75% | -0.93% | -1.07% | -0.09% |
| 1979-3 | -0.47% | 0.08% | 0.29% | 1.54% | -0.01% | 1.43% |
| 1983-3 | -0.91% | 0.19% | -0.27% | -0.78% | 0.09% | -1.68% |
| Avg | -0.72% | 0.39% | 0.12% | -0.04% | -0.36% | -0.61% |
| 1987-3 | -0.61% | 0.59% | 0.23% | 0.09% | -2.31% | -2.01% |
| 1991-3 | 0.27% | -1.36% | -0.82% | 0.98% | 0.05% | -0.88% |
| 1995-3 | 0.42% | 0.09% | -0.21% | -1.42% | -0.08% | -1.21% |
| 1999-3 | 0.13% | -0.46% | 0.82% | -0.39% | -0.64% | -0.55% |
| 2003-3 | 1.25% | -0.30% | -0.32% | 0.79% | -0.25% | 1.17% |
| Avg | 0.29% | -0.29% | -0.06% | 0.01% | -0.65% | -0.70% |
| SPX summary for Presidential Year 3 1955 - 2003 | ||||||
| Avg | -0.22% | 0.01% | 0.16% | 0.06% | -0.36% | -0.35% |
| Win% | 46% | 62% | 62% | 54% | 31% | 31% |
| SPX summary for all years 1953 - 2006 | ||||||
| Avg | 0.00% | 0.11% | 0.08% | -0.01% | -0.15% | 0.03% |
| Win% | 51% | 57% | 50% | 52% | 48% | 50% |
Mutual Fund
Compliance issues demand that I not mention the mutual fund that I manage by name or symbol in this letter.
To see a current chart of the fund go to: http://finance.yahoo.com/q/bc?s=APHAX&t=3m
For information about the fund go to: http://www.thealphafunds.com/index.htm
The fund now has service class shares available.
Conclusion
Most of the internal market indicators have been deteriorating and seasonality for next week offers no support.
I expect the major indices to be lower on Friday May 18 than they were on Friday May 11.
Last week the large cap indices were up slightly and the small cap indices were down slightly so I am calling last weeks negative forecast a tie.
By Mike Burk
To subscribe to this report : http://alphaim.net/signup.html
Mike Burk is an employee and principal of Alpha Investment Management (Alpha) a registered investment advisor. Charts and figures presented herein are believed to be reliable but we cannot attest to their accuracy. Recent (last 10-15 yrs.) data has been supplied by CSI (csidata.com), FastTrack (fasttrack.net), Quotes Plus (qp2.com) and the Wall Street Journal (wsj.com). Historical data is from Barron's and ISI price books. The views expressed are provided for information purposes only and should not be construed in any way as investment advice. Furthermore, the opinions expressed may change without notice.
© 2005-2022 http://www.MarketOracle.co.uk - The Market Oracle is a FREE Daily Financial Markets Analysis & Forecasting online publication.