


Yield Curve Points to Bottoming Process for a Stocks Bear Market
Stock-Markets / Stocks Bear Market Jul 27, 2009 - 02:38 AM GMTBy: Donald_W_Dony

 Bond yields are often ignored when analyzing stock markets. Yet their movements can provide valuable clues to the bottoming process of a bear market.
Chart 1 shows the base of the 2002 bear market and the likely foundation of the present decline. The lower portion of the chart is a relative strength comparison between the long-term US 20-year treasury yields and the short-term US 2-year treasury yields. A rising line indicates a steepening yield curve whereas a falling line signifies a flattening curve.
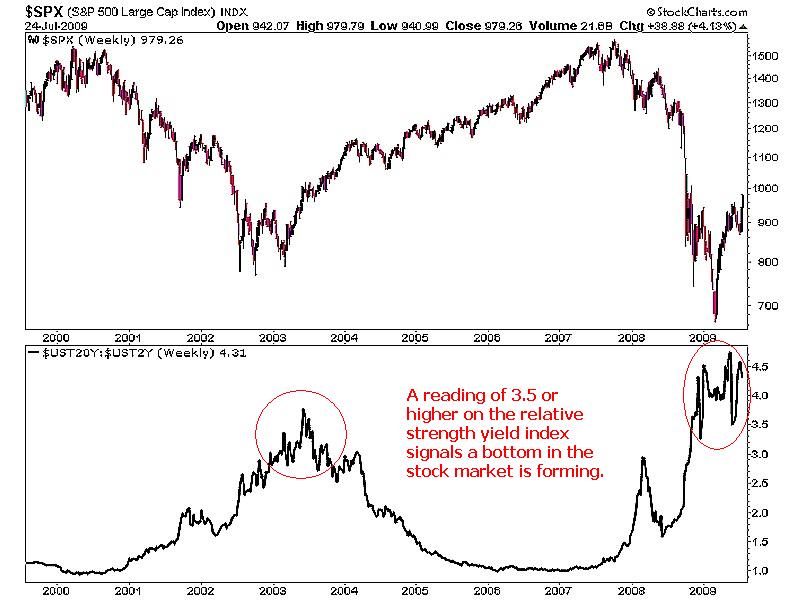
During the long growth phase of a normal business cycle, economic expansion causes central banks to slowly increase their rates on short-term money in an attempt to reduce business growth. This action typically continues until the peak of GDP expansion at which time yield curves are often flat or even inverted. This event occurred in 2000 and in 2006 and early 2007. The flattening of the yield curve usually develops at the stock market peak.
As the equity markets crested (2000 & 2008) and begin to roll over, signs of economic weakness emerge. Central banks started to lower short-term rates to help ward off prolonged economic contraction. This creates a rising line (2001-2003 and 2007-2008) where 20-year bonds yields show greater relative strength than short-term rates.
At the extreme levels of 3.5 or higher. which represents a very steep yield curve, stock markets normally bottom. An important observation is that equity indexes usually base 6-8 months before the peak in the yield curve. This is because the stock market normally leads the economy. Investors are trying to anticipate the near-term economy verses focusing on the present fundamentals.
Bottom line: The relative strength review between long and short-term rates suggest that the S&P 500 is in a bottoming process. Historical data indicates that the yield curve test is not a pin-point measurement to the final low in the stock market, but rather a rough indicator that is usually within 6-8 months of the trough. The current reading of 4.5 would certainly suggest the yield curve has reached a plateau and moderation can be expected in late 2009 or early 2010.
Your comments are always welcomed.
By Donald W. Dony, FCSI, MFTA
www.technicalspeculator.com
COPYRIGHT © 2009 Donald W. Dony
Donald W. Dony, FCSI, MFTA has been in the investment profession for over 20 years, first as a stock broker in the mid 1980's and then as the principal of D. W. Dony and Associates Inc., a financial consulting firm to present. He is the editor and publisher of the Technical Speculator, a monthly international investment newsletter, which specializes in major world equity markets, currencies, bonds and interest rates as well as the precious metals markets.
Donald is also an instructor for the Canadian Securities Institute (CSI). He is often called upon to design technical analysis training programs and to provide teaching to industry professionals on technical analysis at many of Canada's leading brokerage firms. He is a respected specialist in the area of intermarket and cycle analysis and a frequent speaker at investment conferences.
Mr. Dony is a member of the Canadian Society of Technical Analysts (CSTA) and the International Federation of Technical Analysts (IFTA).
Donald W. Dony Archive |
© 2005-2022 http://www.MarketOracle.co.uk - The Market Oracle is a FREE Daily Financial Markets Analysis & Forecasting online publication.