


Stock Market Makes Significant Transition Progress From Bear to Bull Market
Stock-Markets / US Stock Markets Aug 03, 2009 - 09:49 AM GMTBy: Chris_Ciovacco

 The transition from a bear market to a bull market is just that; a transition. Transitions take time and are not binary events like turning a light on or off. Transitions in any market can be frustrating and stressful, but if we continue to focus on the most important and telling indicators, the market should get us pointed in the right direction and aligned with the primary trends.
 While there are numerous signs which can indicate the possible transition from a bear market to a bull market, the following two milestones are of uppermost importance:
- When the 50-day moving average crosses, and more importantly holds above, the 200-day moving average,
- When the slope of the 200-day moving average turns positive.
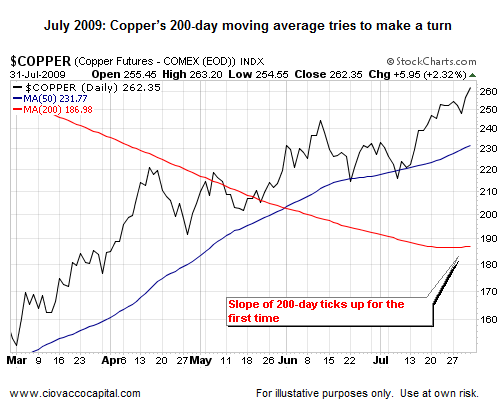
During an established bull market, a good way to eliminate less attractive markets or investment alternatives is to discard those that have a negatively sloped 200-day moving average. At the end of a bear market, it takes time for a market to send signals of the potential staying power of a rally via a positive change in the slope of a 200-day moving average. As shown in the chart below, even though stocks began to bottom in mass in March of this year, we only started to see positive changes in the slopes of 200-day moving averages in the last two weeks.
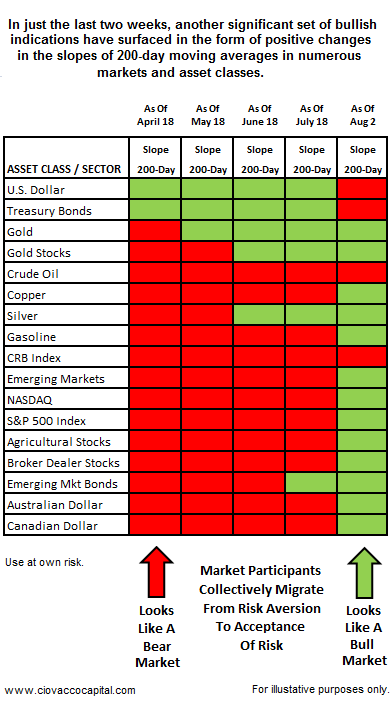
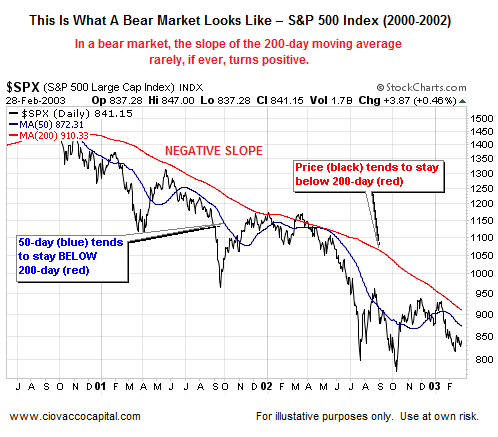
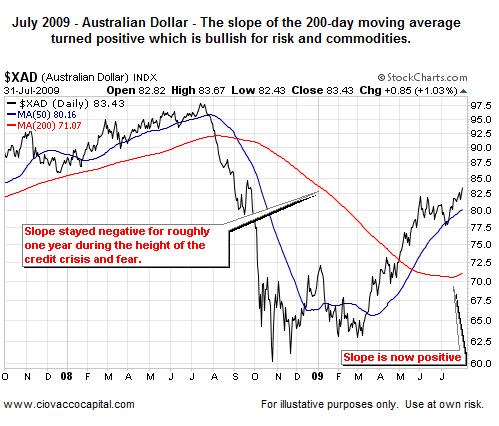
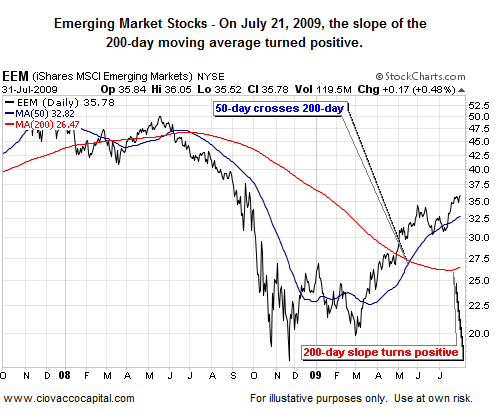
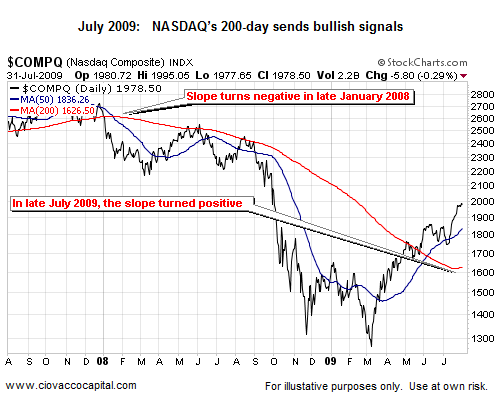
The significance of the slope of the 200-day moving average can be shown via the three charts below. The 200-day moving averages are shown in red.
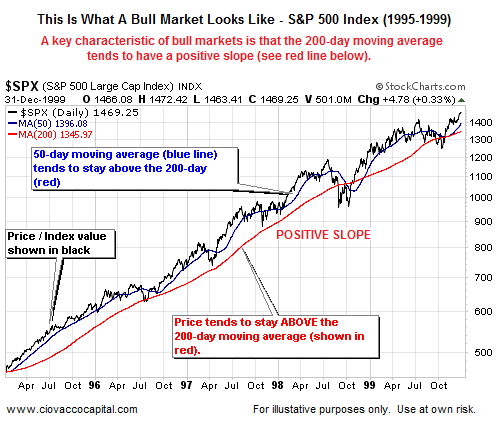
As we have stated in the past, in a bull market:
- Price tends to stay above the 200-day moving average (MA) (red line).
- The 50-day moving average (blue line) tends to stay above the 200-day moving average.
In a bear market, where conviction is lacking to push prices higher:
- Price (black line) tends to stay below the 200-day moving average.
- The 50-day moving average tends to stay below the 200-day moving average.
The table shown below allows you to visualize the transition that has taken place between March 1, 2009 and August 2, 2009. In March (far left side of the table), most markets had the characteristics of a bear market. Currently (right side of table), numerous markets look much more like an early bull market than an on-going bear market.
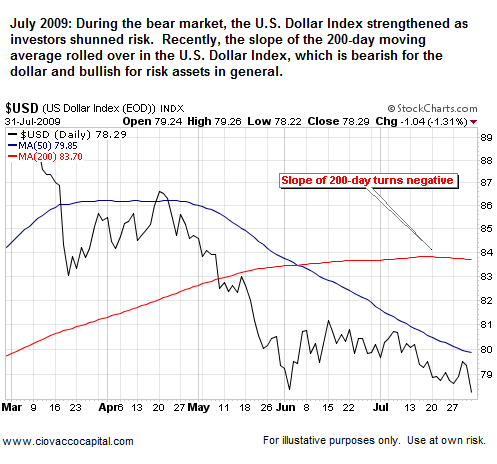
The Dollar’s Move Supports Inflation-Friendly Assets
Notice on the left side of the chart above, the U.S. Dollar had bullish characteristics as investors looked for relatively safe havens and avoided risk. The chart below illustrates the possible on-going reversal of this trend.
The charts below show bullish moves related to the slope of 200-day moving averages (shown in red).
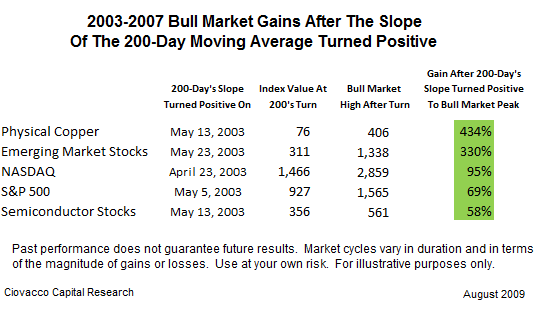
While we are not expecting the current bull market to last as long as the 2003-2007 bull market, it is not unrealistic to believe that markets could run further in 2009 after the slopes of their 200-day moving averages have turned up. The purpose the chart below is to suggest further gains may be possible, not to suggest the magnitude of the potential gains during the balance of 2009 and beyond. Obviously, conditions in 2003 were different from current conditions, but the basic concepts of the transition from a bear market to a bull market still apply in 2009. The chart below can help us overcome the fear of the current bull having little room to potentially run from current levels.
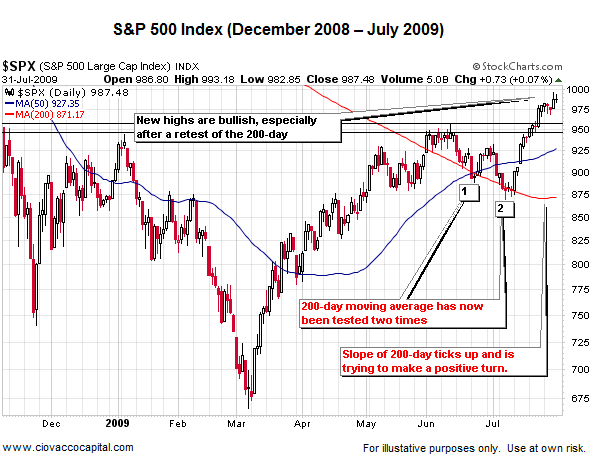
S&P 500’s Recent Retest Is Very Important To Bullish Case The S&P 500’s correction between mid-June and early July and subsequent highs were important steps in the possible transition from a bear market to a bull market.
The Bears Can Make A Strong Case Just As They Could In 2003
Even in the most bullish of economic and financial market conditions, it is easy to find bearish commentary and bearish forecasts. Therefore, it is not surprising that in 2009 it is easy to find support for the bearish case. We understand and respect the bearish case. However, the market is currently aligned with the bullish case. To illustrate the possible pitfalls of being overly reliant on bearish commentary and any forecast, we present the following bearish commentary and arguments from a balanced USA Today article, Many wonder if this stock market rally is sustainable (May 8, 2003). As you read the comments below, keep in mind the S&P 500 stood at 927 when its 200-day moving average turned up in May of 2003 (and when the comments below were published). The new bull market that began in 2003 did not end until the S&P 500 reached 1,565 in 2007. After the bearish commentary below was published in 2003, the S&P 500 gained roughly 70%.
But for every potential positive, there is an offsetting worry. Brian Belski, fundamental market strategist at U.S. Bancorp Piper Jaffray notes that betting on an economic recovery has been a losing strategy. And with analysts still expecting double-digit profit growth in the second half of the year, and still no concrete signs of a full-fledged economic recovery, the likelihood of the rally fizzling is high. "It's unlikely the market can sustain the type of run it's on," Belski says. "The major upside move is over," at least for now.
We should point out that USA Today also presented the bullish case for their readers in 2003. Despite the bearish commentary and analysis above, the market did not go down, nor did it go sideways; it went up further than most could have imagined in May of 2003.There are other bugaboos lurking that could short-circuit the rally. One big potential negative is if the economy falls into a deflationary spiral. On Tuesday, the Federal Reserve said they could not rule that out, although they say the risk remains small. Deflation is a profit killer. "In a deflationary cycle," says Al Schwartz, an analyst at Schaeffer's Investment Research, "businesses have no pricing power, (and) consumers are hesitant to spend because they know prices will be cheaper tomorrow." The result is that companies fail to hire workers, setting in motion a painful economic spiral. Burdensome debt loads become too much for people to handle, so they sell assets such as stocks and real estate to meet the payments. That, in turn, causes a tumble in prices of stocks, bonds, real estate and other assets.
Hochberg of Elliott Wave also says this is just another bear market rally. He won't deny it's been a good rally the past few weeks. But the key words are "has been," he notes. His firm has studied every financial mania, from the tulip bulb craze in the 1600s to the 1929 U.S. stock crash to the Japanese implosion that began in the late 1980s. The key finding: "All manias have one thing in common: They all slide back below their starting point." If the 1990s tech bubble follows the same pattern, there is more pain ahead.
John Bollinger of Bollinger Capital Management calls this "the giant sideways." If that is the case, investors who want to make money must get out of stocks during rallies and get back in during slumps.
Fundamental and Technical Alignment
In 2009, the market is sending numerous bullish signals that compare favorably with the end of a bear market and the beginning of a new bull market. The market is recognizing that earnings have been coming in well above expectations. Numerous economic data sets are pointing to the real possibility of positive GDP numbers later this year or early next year. Currently, the market is clearly supporting the bulls in terms of their fundamental arguments, which include some evidence of a bottoming process in housing, stabilization in unemployment, and some improvement in the earnings outlook. As long as the bullish signals remain in place, it is prudent to pay attention to them. If the market deteriorates and the signals migrate back to a bearish stance, we must be open-minded enough to accept the possibility of the return of the bear.
These comments, taken from a portion of an update for CCM clients, may not pertain to or be appropriate for many investors based on their risk tolerance and situation. They are presented for educational purposes only.
Some additional charts supporting the current positive technical environment can be found in June 19, 2009 article Bullish Trends and Significant Corrections.
By Chris Ciovacco
Ciovacco Capital Management
Copyright (C) 2009 Ciovacco Capital Management, LLC All Rights Reserved.
Chris Ciovacco is the Chief Investment Officer for Ciovacco Capital Management, LLC. More on the web at www.ciovaccocapital.com
Ciovacco Capital Management, LLC is an independent money management firm based in Atlanta, Georgia. As a registered investment advisor, CCM helps individual investors, large & small; achieve improved investment results via independent research and globally diversified investment portfolios. Since we are a fee-based firm, our only objective is to help you protect and grow your assets. Our long-term, theme-oriented, buy-and-hold approach allows for portfolio rebalancing from time to time to adjust to new opportunities or changing market conditions. When looking at money managers in Atlanta, take a hard look at CCM.
All material presented herein is believed to be reliable but we cannot attest to its accuracy. Investment recommendations may change and readers are urged to check with their investment counselors and tax advisors before making any investment decisions. Opinions expressed in these reports may change without prior notice. This memorandum is based on information available to the public. No representation is made that it is accurate or complete. This memorandum is not an offer to buy or sell or a solicitation of an offer to buy or sell the securities mentioned. The investments discussed or recommended in this report may be unsuitable for investors depending on their specific investment objectives and financial position. Past performance is not necessarily a guide to future performance. The price or value of the investments to which this report relates, either directly or indirectly, may fall or rise against the interest of investors. All prices and yields contained in this report are subject to change without notice. This information is based on hypothetical assumptions and is intended for illustrative purposes only. THERE ARE NO WARRANTIES, EXPRESSED OR IMPLIED, AS TO ACCURACY, COMPLETENESS, OR RESULTS OBTAINED FROM ANY INFORMATION CONTAINED IN THIS ARTICLE. PAST PERFORMANCE DOES NOT GUARANTEE FUTURE RESULTS.
Chris Ciovacco Archive |
© 2005-2022 http://www.MarketOracle.co.uk - The Market Oracle is a FREE Daily Financial Markets Analysis & Forecasting online publication.
Comments
|
TraderJoe
05 Aug 09, 14:58 |
Sitting on the Fence
Chris No one makes money by sitting on the fence, only be taking a view and investing, therefore whats the purpose of this ? |