


Long Term U.S. Treasury Yields, Someone Is Going To Be Wrong
Interest-Rates / US Bonds Aug 26, 2009 - 10:24 AM GMTBy: Guy_Lerner

 For over 8 months now, I have been chronicling the plight of the 10 year Treasury bond. Based upon the "next big thing" indicator it was my expectation that yields on the 10 year Treasury bond would rise once there was a monthly close above a yield of 3.342%. This occurred at the end of May, 2009.
See figure 1 a monthly chart of the yield on the 10 year Treasury bond. The "next big thing" indicator is in the lower panel, and the close over the "key" pivot low point is identified with the blue up arrows. Once this technical metric was met within the confines of the "next big thing" indicator being in the position where we would expect a secular trend change, it was my expectation that this would result in higher yields over the next 12 months.
Figure 1. $TNX.X/ monthly
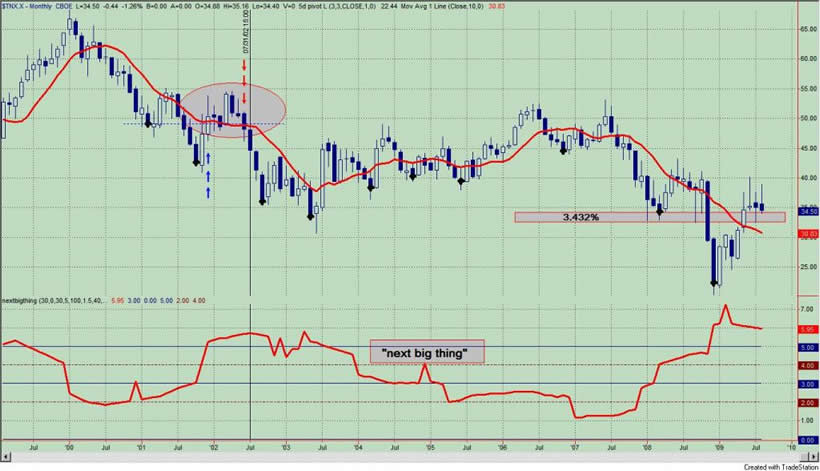
Technically, the set up is there, but the fundamentals for higher yields have always been questionable. Some of the fundamental headwinds for higher yields include: 1) rising unemployment; 2) a deflationary environment as reflected in 50 plus year low in CPI; 3) an economy that has "leveled out" but that has yet to demonstrate any real growth. Despite the technical signal 3 months ago, the fundamentals have not appreciably changed. Furthermore, the Fed's back stopping of the bond market has put an unknown bid behind Treasury bonds.
Treasury yields did "pop" to 4.014% in June, but there has not been any follow through, and looking back to figure 1, we note that Treasury yields are sitting just above support.
But here is the point: Treasury yields have not moved higher; in other words, the Treasury market is not discounting the economic recovery. On the other hand, the stock market has roared ahead discounting the recovery (and then some). This divergence is noticeable, and it appears someone is going to be wrong.
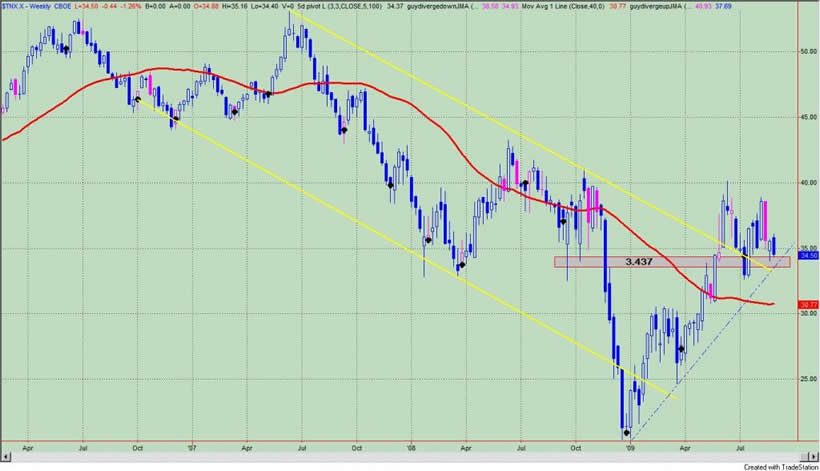
Now let's drill down and look at a weekly chart of the 10 year Treasury yield. See figure 2. The pink markers over the price bars are negative divergence bars, and we note a cluster of these suggesting that upside momentum has been severely curtailed.
Figure 2. $TNX.X/ weekly
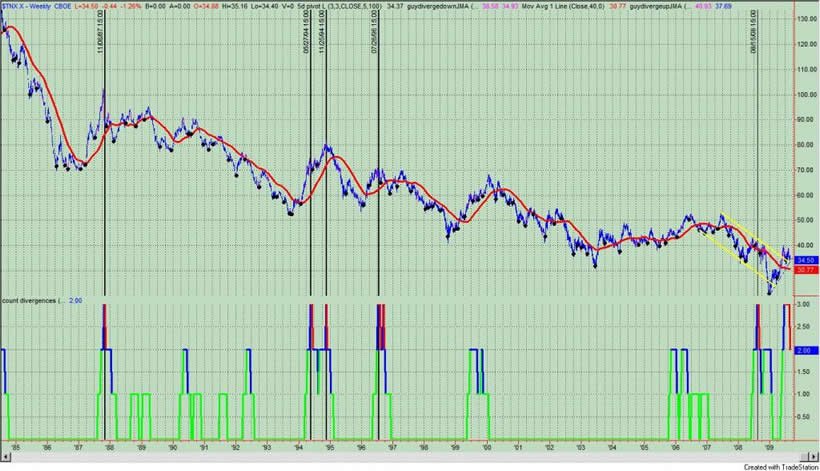
I had previously pointed out (see: "How Will We Know If The Secular Trend In 10 Year Treasury Yields Is For Real?") that such a cluster of negative divergence bars was an ominous sign for higher yields. See figure 3, a weekly chart of the 10 year Treasury yield. The indicator in the lower panel counts the number of negative divergence bars occurring over the prior 13 week period. When the indicator is red, it means that there are at least 3 negative divergence bars occurring over a 13 week period. As you can see, the prior 5 times going back to 1987 generally marked the top in 10 year Treasury yields; prior to 1987 (and not shown on the chart), there were 2 other occurrences - one resulted in a big sell off while the other was mild. So we should respect this pattern!
Figure 3. $TNX.X/ weekly
But let's take a closer look at figure 2. A weekly close below a yield of 3.437% would be a sign of lower yields within the context of these multiple negative divergence bars. Furthermore, the breakout from the channel would be a failure, and the blue up trend line would be broken. Technically, the 10 year Treasury yield is looking into the abyss of a failed signal. A monthly close below the 3.342% would be further confirmation of lower yields.
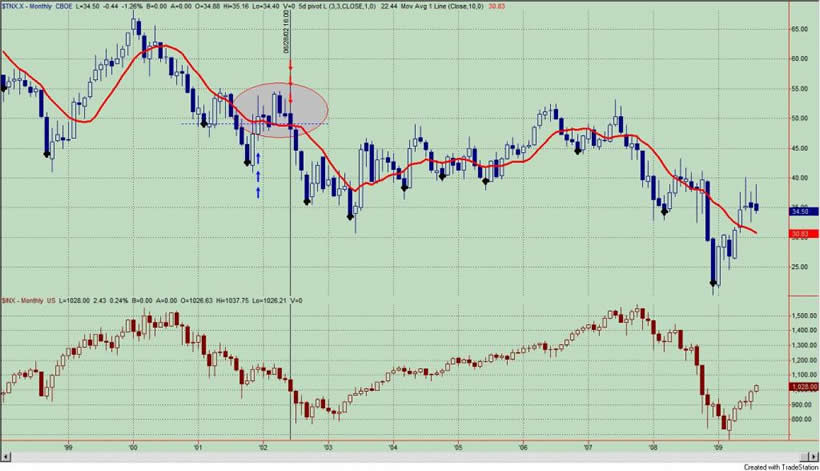
Two other points are noteworthy. One, a failure of this signal does not necessarily imply a secular trend change for Treasury bonds; they may be good for a trade but I don't see a secular trend developing from these low level of yields. Two, a failed signal in Treasury yields has a reasonable chance of signalling the top in equities. In other words, the divergence between lower yields - a sign of economic weakness - and higher equity prices - a sign of economic strength - will not persist for long. Most importantly, it was the failed signal in June, 2002 that coincided with a 25% plus drop in equities over the next two months. It should be noted that the current set up in Treasury yields and likely failure is exactly the same as in 2002!
Figure 4 is a monthly chart of the 10 year Treasury yield compared to the S&P500 (lower panel), and the failed signal in 2002 is highlighted in the oval.
Figure 4. $TNX.X v. S&P500/ monthly
To summarize, technical weakness seems likely in 10 year Treasury yields. This is sign of economic weakness and it is at divergence with the strength in equities. It would seem likely that this divergence will not persist for long. The current set up in 10 year Treasury yields is reminiscent of 2002, and it should be noted that a failed signal in the 10 year Treasury yields led to a significant down draft in equities.
By Guy Lerner
http://thetechnicaltakedotcom.blogspot.com/
Guy M. Lerner, MD is the founder of ARL Advisers, LLC and managing partner of ARL Investment Partners, L.P. Dr. Lerner utilizes a research driven approach to determine those factors which lead to sustainable moves in the markets. He has developed many proprietary tools and trading models in his quest to outperform. Over the past four years, Lerner has shared his innovative approach with the readers of RealMoney.com and TheStreet.com as a featured columnist. He has been a regular guest on the Money Man Radio Show, DEX-TV, routinely published in the some of the most widely-read financial publications and has been a marquee speaker at financial seminars around the world.
© 2009 Copyright Guy Lerner - All Rights Reserved
Disclaimer: The above is a matter of opinion provided for general information purposes only and is not intended as investment advice. Information and analysis above are derived from sources and utilising methods believed to be reliable, but we cannot accept responsibility for any losses you may incur as a result of this analysis. Individuals should consult with their personal financial advisors.
Guy Lerner Archive |
© 2005-2022 http://www.MarketOracle.co.uk - The Market Oracle is a FREE Daily Financial Markets Analysis & Forecasting online publication.