


Treasury Bond Market Bullish Sentiment, Circumstances Are Different
Interest-Rates / US Bonds Sep 16, 2009 - 06:34 AM GMTBy: Guy_Lerner

 If you have been paying attention the last couple of weeks, I have been warming up to bonds. However, earlier in the year, I thought that Treasury yields would head higher (i.e., bonds lower), and that this would result in a secular trend change. In other words, we would be embarking on a long period of increasing yield pressures. This did not come to pass although yields on the 10 year Treasury bond did reach 4.0%. Despite this failed signal, Treasury yields still have the technical characteristics of an asset poised to undergo a secular trend change, and by secular, I mean lasting years. But not now.
For now, I think a better bet is on higher Treasury bond prices. At least over the next couple of months. In previous articles I have addressed some of the technical reasons why we might see higher prices with Treasury Inflation Protected Securities and why we should see lower yields.
From a sentiment perspective, I have two sources that appear to be at odds with each other. The first comes from Mark Hulbert at MarketWatch. His most recent article is entitled, "Bond Bullishness: Bond timers more exuberant than any time since March, 2001". According to Hulbert, his Hulbert Bond Newsletter Sentiment Index (HBNSI) stood at 62.2%, and "the last time it was higher was March 28, 2001, when the HBNSI stood at 62.7%. Far from rising thereafter, bonds plunged and interest rates rose. Over the subsequent two months, in fact, the CBOE's 10-Year Treasury Yield Index rose from 4.97% to 5.55% -- a big jump in so short a period of time for the normally-staid government bond market."
While Hulbert's statement is true and reason for concern (if you are betting on higher bond prices), the reality is that the bump in yields that he speaks of really was just a counter trend rally within a longer term down trend for the 10 year Treasury yield. In other words, this was just a pullback on the road to higher bond prices. (However, I would not want to have been a buyer of bonds on March 30, 2001). See figure 1 (top price chart), a weekly graph of the yield on the 10 year Treasury bond. March 28, 2001 (i.e., the last major high in the HBNSI) is marked with the red vertical line.
Figure 1. $TNX.X v. S&P500/ weekly
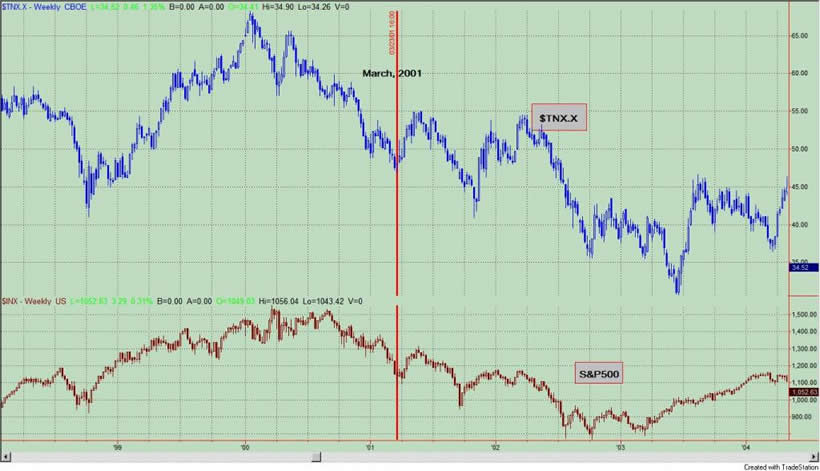
There is another important point worth mentioning: the S&P500 had been in a down trend for the preceding 6 months, and at the end of March, 2001 stocks bounced and so did yields. This can be seen in figure 1 with the S&P500 in the lower panel. So back in March, 2001 (when bond sentiment was so bullish), bonds had been outperforming equities for over 6 months. In addition, investors were very bearish on equities and this would be considered a bullish signal for equities. So it would make sense that investors would sell bonds and move into equities. And that is what they did for 8 weeks, and then the down trend in yields (higher Treasury bonds) and equities resumed.
Now let's fast forward to September, 2009. Bonds have been under performing relative to stocks, which have been going up and up for 6 straight months. Investor sentiment towards equities is extremely bullish. So our investing environment is quite different now, and despite the bullish bond sentiment, the investing environment is 180 degrees opposite that of March, 2001.
Just to confuse the situation even more let me show you another sentiment index. This one comes from the Market Vane Corporation. Market Vane publishes the Bullish Consensus, which is the degree of bullish sentiment for a particular market. From the Market Vane website: "The Bullish Consensus is compiled daily by tracking the buy and sell recommendations of leading market advisers and commodity trading advisers relative to a particular market. The advice is collected by: 1. Reading a current copy of the market advisers' market letter. 2. Calling hotlines provided by advisers. 3. Contacting major brokerage houses to learn what the house analyst is recommending for the different markets. 4. Reading fax and E-mail sent from advisers. The buy and sell recommendations from each adviser are tracked during the day to verify the entry and exit of each trading position. The Bullish Consensus is compiled at the end of the day to reflect the open positions of the advisers as of that day's market close."
How does one interpret the sentiment values from Market Vane? A Bullish Consensus of 65% for an asset implies that 65% of the traders are bullish and expect the price of that asset to rise. Conversely, 35% of the traders are bearish and expect prices to decline.
Figure 2 is a weekly chart of the yield on the 10 year Treasury with the Market Vane Bullish Consensus for Treasury Bonds in the lower panel. The recent low value for the Bullish Consensus occurred in early June, 2009, and it was at 41%. This means that 41% of bond investors were bullish on bonds and 59% were bearish. Since mid-2000, when the Bullish Consensus went below 43% (i.e., 57% bears), yields were likely to top out (as in figure 2) or bonds went higher. These times are noted by the red vertical bars.
Figure 2. $TNX.X v. Market Vane Bullish Consensus Treasury Bonds/ weekly
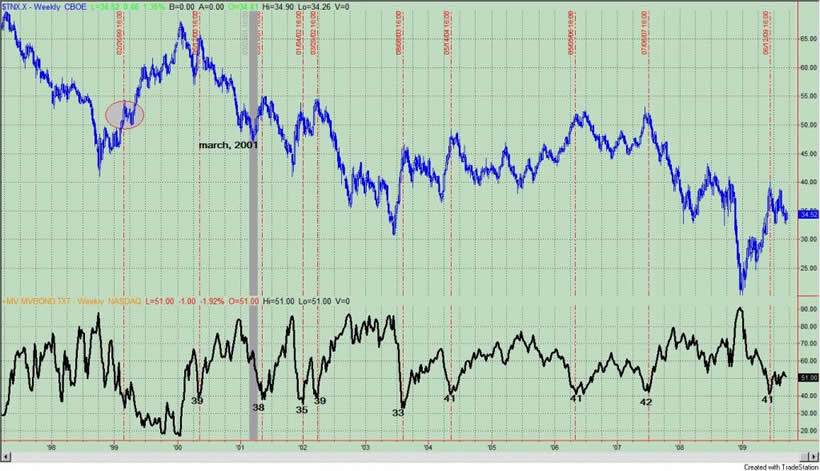
Not all signals are accurate as seen by the failed signal in 2000 (which is the red vertical bar with the gray oval on it). But this data provides a different picture than the HBNSI. Currently only 51% of the Market Vane respondents are bullish on bonds. Typically, peaks in bonds (or troughs in yields) occur when the value gets above 70%.
Oddly enough, the Market Vane Bullish Consensus was at 55% bulls back in March, 2001. Six weeks prior the value peaked in the 80's suggesting that a bounce in yields was in the offering. (This time period is noted by the gray vertical bar in figure 2.) The current value, while at 51% bulls, is coming from a modest low of 41%.
In sum, bond investors may be bullish like March, 2001, but circumstances are clearly different.
By Guy Lerner
http://thetechnicaltakedotcom.blogspot.com/
Guy M. Lerner, MD is the founder of ARL Advisers, LLC and managing partner of ARL Investment Partners, L.P. Dr. Lerner utilizes a research driven approach to determine those factors which lead to sustainable moves in the markets. He has developed many proprietary tools and trading models in his quest to outperform. Over the past four years, Lerner has shared his innovative approach with the readers of RealMoney.com and TheStreet.com as a featured columnist. He has been a regular guest on the Money Man Radio Show, DEX-TV, routinely published in the some of the most widely-read financial publications and has been a marquee speaker at financial seminars around the world.
© 2009 Copyright Guy Lerner - All Rights Reserved
Disclaimer: The above is a matter of opinion provided for general information purposes only and is not intended as investment advice. Information and analysis above are derived from sources and utilising methods believed to be reliable, but we cannot accept responsibility for any losses you may incur as a result of this analysis. Individuals should consult with their personal financial advisors.
Guy Lerner Archive |
© 2005-2022 http://www.MarketOracle.co.uk - The Market Oracle is a FREE Daily Financial Markets Analysis & Forecasting online publication.