


Bond Funds Price Change vs Volatility
Interest-Rates / US Bonds Sep 21, 2009 - 03:52 PM GMTBy: Richard_Shaw

 Stock volatility versus price change gets a lot of financial media attention, but bonds don’t get so much.
Bonds are an important part of portfolios that deserve investigative attention too.
This article provides data for bond funds of various types in terms of price rate of change (not total return) versus price volatility to help “do-it-yourself” investors with their bond fund decisions.
Fund total return is ultimately more important than price change in theory, but in practice price change tends to strongly drive entry and exit behavior (including stop loss orders on exchange traded funds), which modifies realized total return. That makes examining price change a useful element in the full set of data for a bond fund.
To complement that data, we include a table of fundamental bond fund information, and a table of price change correlation to the aggregate bond index.
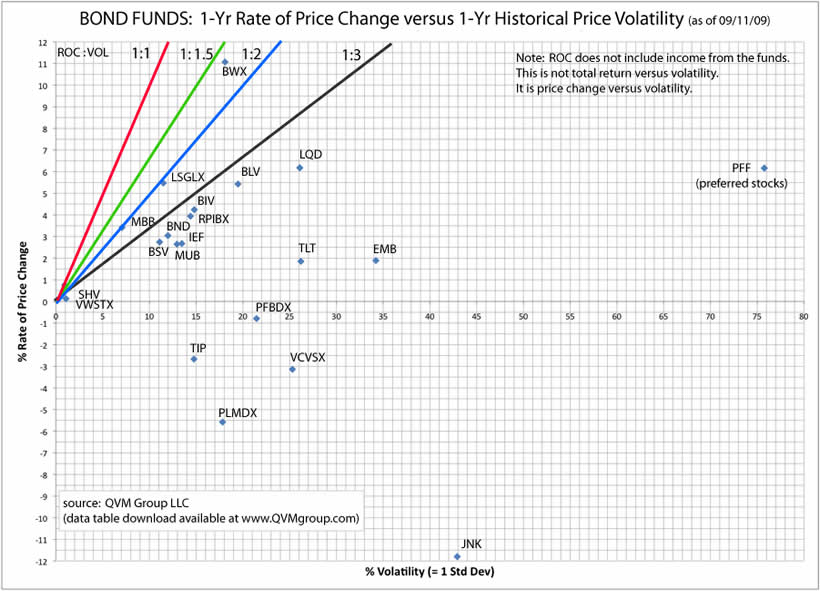
Reward-to-Risk Scatter Diagram (1-year):
A plot of the 1-year rate of price change (ended 9/11/2009) versus the 1-year price volatility for 20 types of bond funds plus preferred stocks, shows dramatic performance differences.
Developed markets local currency sovereign debt (BWX) generated the most favorable ratio reward-to-risk (rate-of-change divided by volatility). Not far behind were actively managed global bonds by Loomis Sayles (LSGLX) and US agency backed mortgage securities (MBB).
On the other end of the scale, the most strongly unfavorable reward-to-risk ratio was for junk bonds (JNK), with a negative return and high volatility. Preferred stocks (PFF) had a positive return, but more than ten times the volatility.
Less dramatic, but still unfavorable, were emerging market bonds, both local currency denominated (PLMDX) and US currency denominated (EMB), as well as convertible bonds (VCVSX), inflation protected Treasuries (TIP), long-term Treasuries (TLT) and actively managed unhedged international bonds (PFBDX).
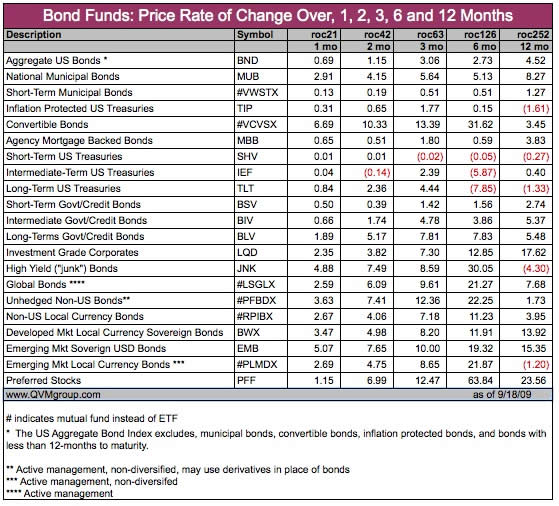
The next two tables, provide the detail supporting this reward-to-risk scatter diagram. They also provide rate of change and volatility for several periods shorter than one year.
Rate of Price Change:
This table itemizes the price change of each fund type over one month, two months, three months, six months, and twelve months through 09/18/2009.
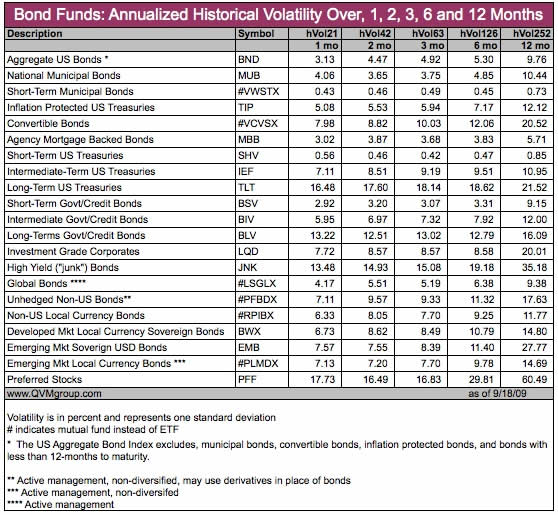
Price Volatility:
This table itemizes the volatility of each fund type over one month, two months, three months, six months, and twelve months through 09/18/2009.
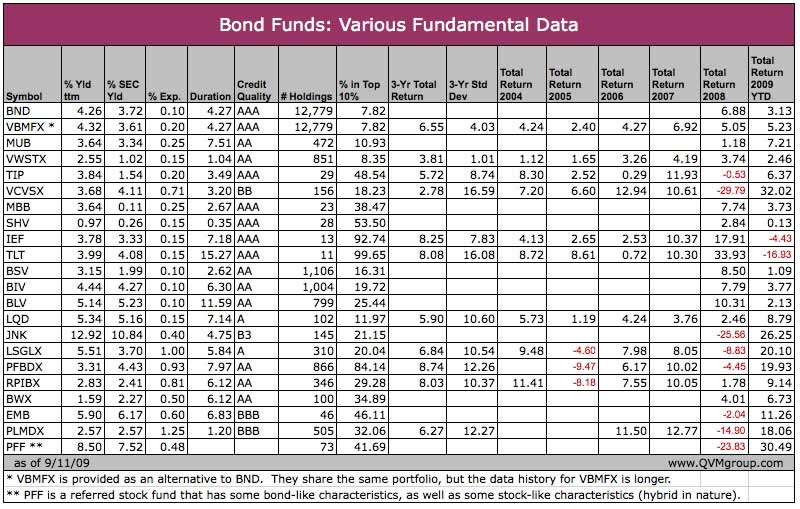
Fundamental Data and Calendar Total Returns:
As you think through what types of bond funds you would like to include in your portfolio, this table (through 09/11/2009) of yields, expenses, duration, credit quality, 3-year total return and standard deviation, and calendar year total returns will be helpful too.
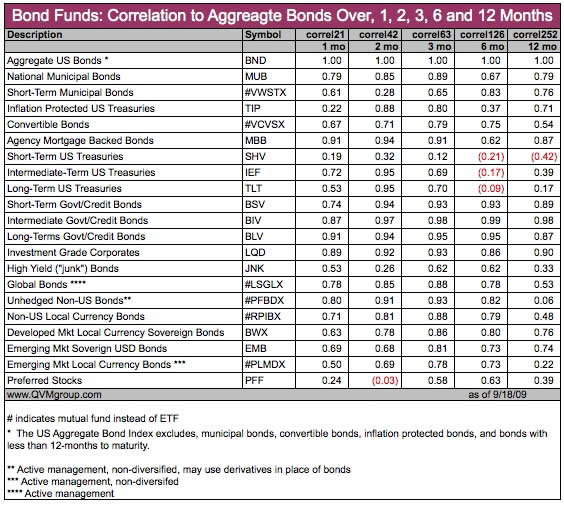
Price Change Correlation to Aggregate Bonds Index:
Finally, this table (through 09/18/2009) shows the correlation of daily price change to the aggregate bond index for one month, two months, three months, six months, and twelve months.
Collectively, data in this article may be helpful to you as a “do-it-yourself” investor when composing the bond portion of your portfolio.
Don’t forget to read the prospectus and to study the detailed holdings of each fund before investing.
Also, once you narrow your choice of funds, build a correlation matrix to make sure you are getting helpful correlation differences between and amongst the funds and the other non-bond assets under consideration.
Securities named in this article: BND MUB, VWSTX, TIP, VCVSX, MBB, SHV, IEF, TLT, BSV, BIV, BLV, LQD, JNK, LSGLX, PFBDX, RPIBX, BWX, EMB, PLMDX, PFF.
Disclosure: We hold several of the named securities in various portfolios.
By Richard Shaw
http://www.qvmgroup.com
Richard Shaw leads the QVM team as President of QVM Group. Richard has extensive investment industry experience including serving on the board of directors of two large investment management companies, including Aberdeen Asset Management (listed London Stock Exchange) and as a charter investor and director of Lending Tree ( download short professional profile ). He provides portfolio design and management services to individual and corporate clients. He also edits the QVM investment blog. His writings are generally republished by SeekingAlpha and Reuters and are linked to sites such as Kiplinger and Yahoo Finance and other sites. He is a 1970 graduate of Dartmouth College.
Copyright 2006-2009 by QVM Group LLC All rights reserved.
Disclaimer: The above is a matter of opinion and is not intended as investment advice. Information and analysis above are derived from sources and utilizing methods believed reliable, but we cannot accept responsibility for any trading losses you may incur as a result of this analysis. Do your own due diligence.
Richard Shaw Archive |
© 2005-2022 http://www.MarketOracle.co.uk - The Market Oracle is a FREE Daily Financial Markets Analysis & Forecasting online publication.