


Saving the U.S. Dollar and Bearish Gold Volume
Currencies / US Dollar Oct 19, 2009 - 06:04 AM GMTBy: Ronald_Rosen

 It has been said that not even the U. S. Marine Corps can save the dollar. However, the way things appear, and according to the Delta Long Term turning points, the Marines may succeed in a delaying action for about twelve months. Desperate times require desperate means. The U. S. Dollar, starting about now, may actually rally right up to the mid term elections in November 2010. Perhaps we should include American politics as one of our market timing tools.
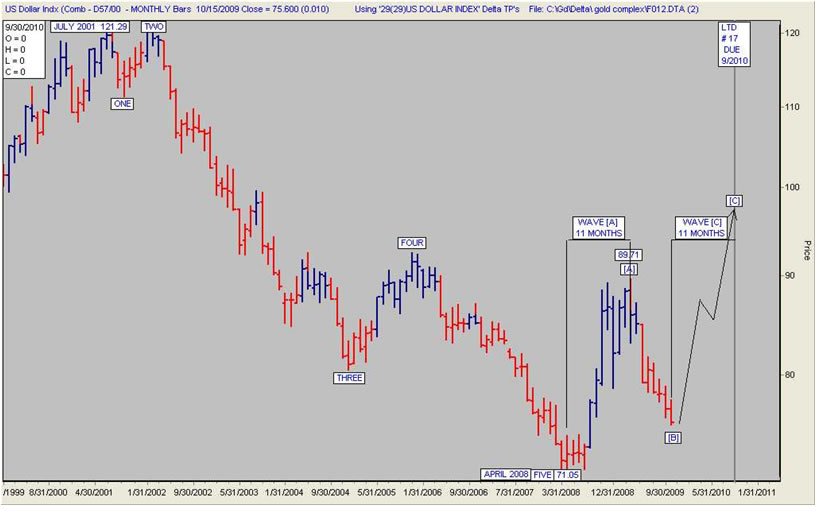
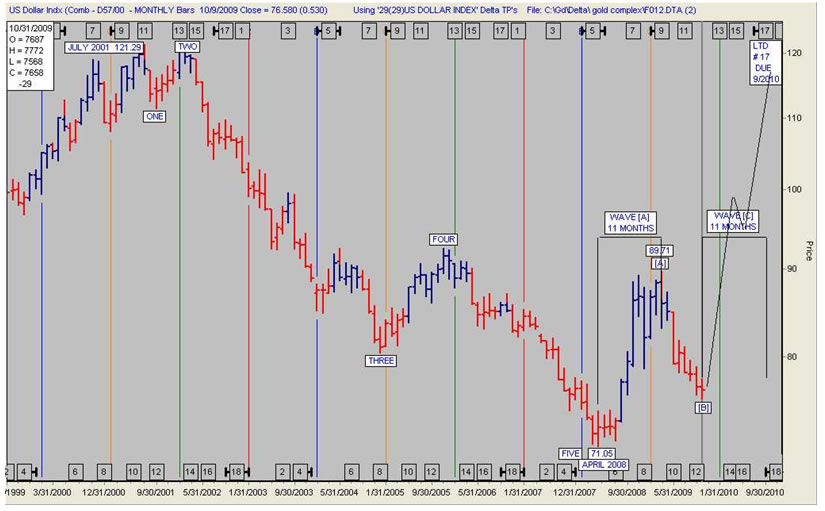
The U. S. Dollar Index peaked in July 2001 at 121.29. It completed a Major Five Wave move down in April 2008. Since the bottom in April 2008 the Dollar Index has been working on a three wave upward correction of the decline. The first or [A] wave rallied from the low at 71.05 to a peak at 89.71. The [A] wave consumed eleven months. The [B] wave down appears to have bottomed this week. The [C] wave of an [A], [B], [C] correction often consumes approximately the same amount of time as the [A] wave. The probabilities favor the dollar peaking in wave [C] around the time that Congressional elections are taking place in the United States. Elections will be held in November 2010.
U. S. DOLLAR INDEX MONTHLY
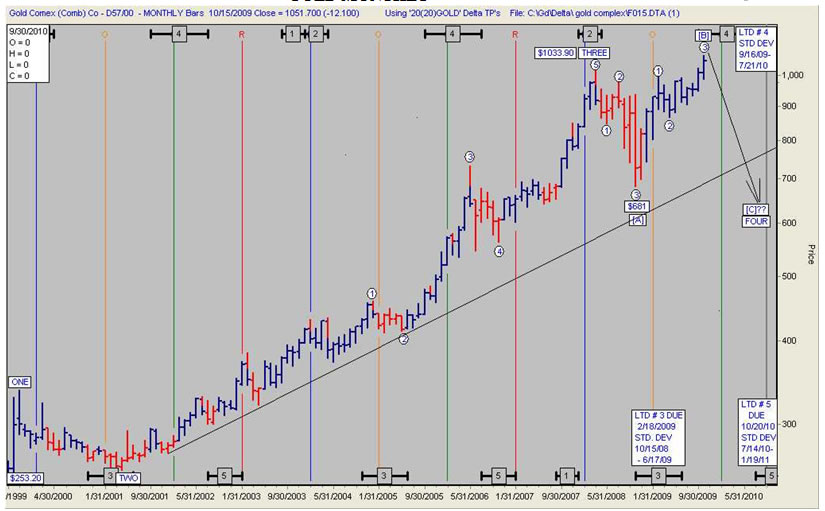
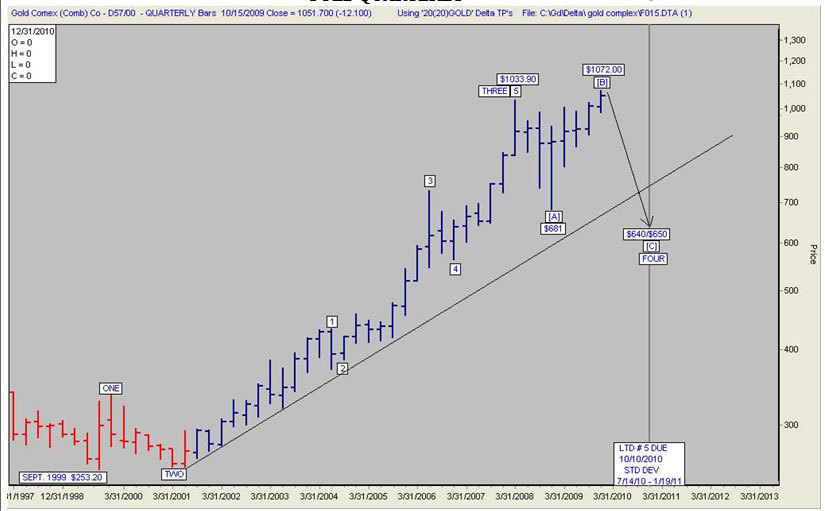
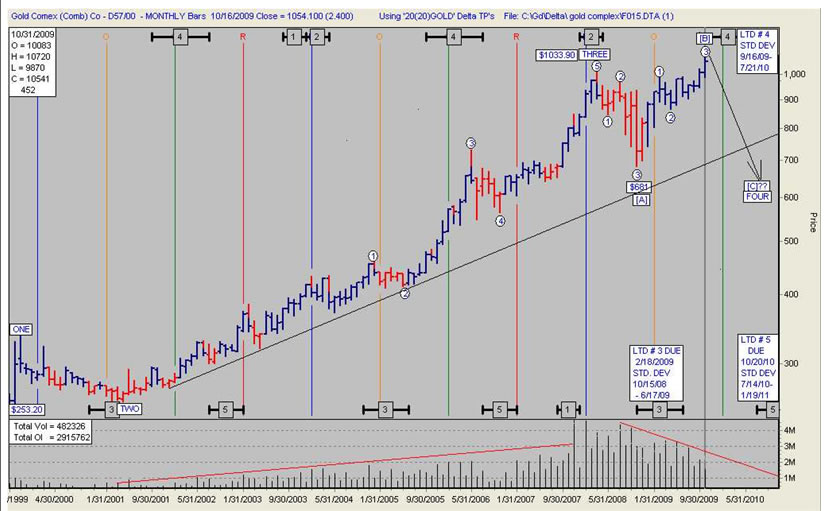
Gold bullion peaked at $1,033.90 in a Major Wave Three in March 2008, one month before the U. S. Dollar Index peaked. Gold bullion has been undergoing an expanded flat correction ever since the peak in March 2008. An expanded flat correction can be highly deceptive because the [B] wave makes a new high. Confirmation of the new high in gold is missing. If gold were beginning a new bull surge we should expect the Dollar Index to be making a new low or close to making a new low and the gold share indexes, the HUI, and the XAU close to making new highs or leading the way to new highs. None of these events has taken place. It appears that as gold peaks in wave [B] it will be moving down to Delta Long Term # 5 low. LTD # 5 low is due to arrive October 10, 2010. That is just in time for the Congressional elections in November 2010 in the United States.
GOLD MONTHLY
 “Far more common, however, is the variety called an expanded flat, which contains a price extreme beyond that of the preceding impulse wave. In expanded flats, wave B of the 3-3-5 pattern terminates beyond the starting level of wave A, and wave C ends more substantially beyond the ending level of wave A” E. W. P.
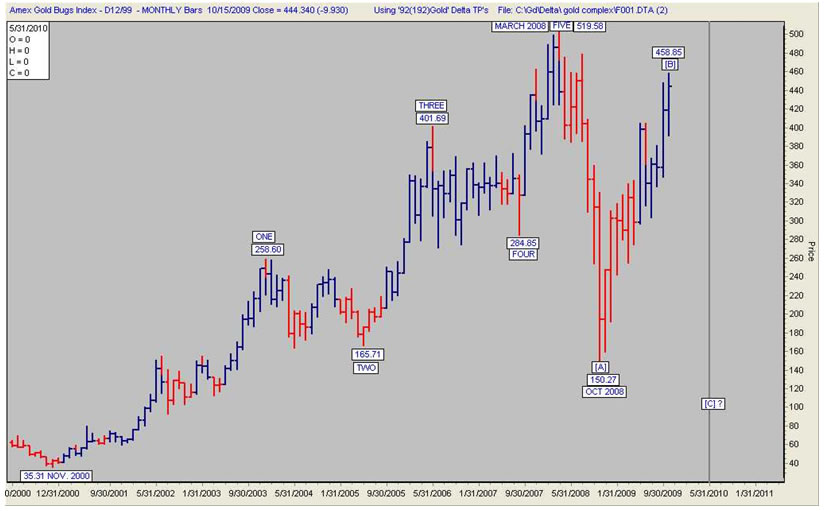
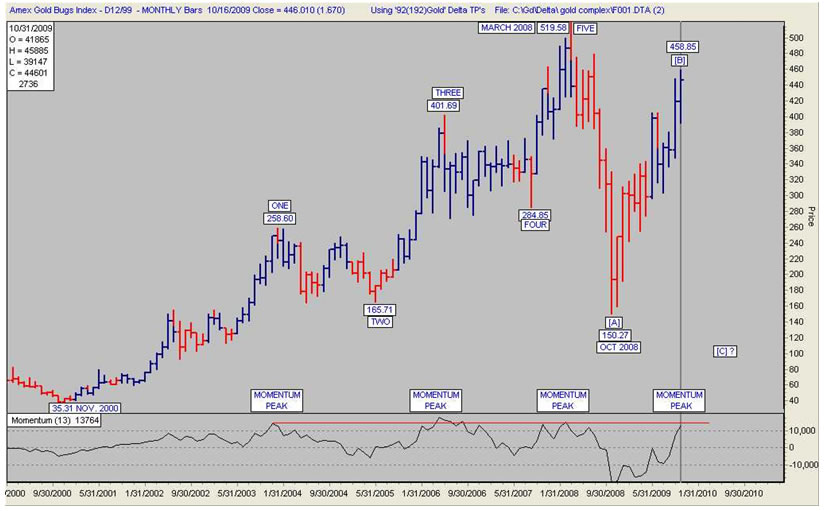
The [C] leg of the expanded flat correction in gold should be bottoming below the low of the [A] wave. The [A] wave bottomed at $681.00. A bottom below $681.00 will undoubtedly be disastrous to the precious metal shares. At the bottom of the [A] leg at $681.00 the HUI was trading at 150.27. If gold bottoms below $681.00 it is reasonable to assume that the HUI will bottom below 150.27. Therein lies the opportunity for us to acquire precious metal shares at bargain prices. All that is required is patience and the markets to fulfill the projections I have outlined.
GOLD QUARTERLY
A decline in the HUI to below the low of wave [A] will be devastating to those holding the precious metal shares. Those subscribers who are well versed in short selling and use stops should have a field day on the way down.
Just how good are the probabilities that the scenario I have been describing will actually take place? It appears that the Delta Long Term turning points for the dollar are presenting us with a rather high probability clue. Let’s review them once again.
HUI MONTHLY
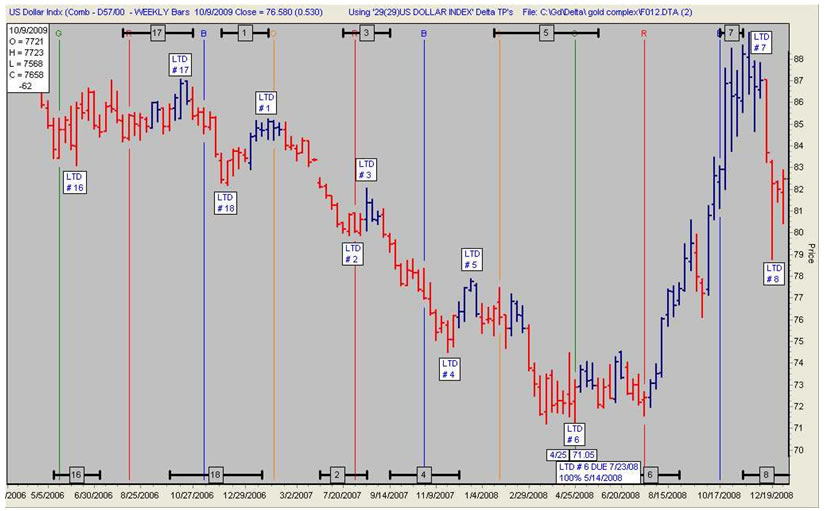
The Delta Long Term turning points for the U. S. Dollar Index are providing us with an extremely important message. The importance of the message depends on whether or not I have placed the LTD’s for the U. S. Dollar Index in the proper rotation. I believe that I have done so. In order to demonstrate the fact that they are in the proper rotation I have posted the following two charts. They are continuous weekly charts of the U. S. Dollar Index. I have noted where the LTD turning points have arrived ever since May 2006. The Dollar Index is either in the process of bottoming or has bottomed.
U. S. DOLLAR INDEX CHART # 1
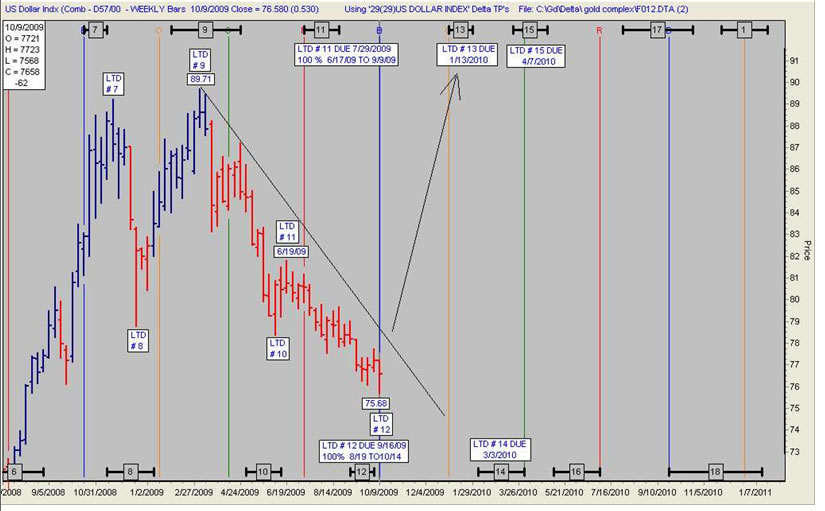
The Delta Long Term turning points for the Dollar Index have been a profitable guide for traders and investors. The next chart of the Dollar Index shows the eleven months consumed by wave [A] up. Since the [C] wave usually consumes a similar amount of time it would be natural for the [C] wave to top at LTD # 17 high. LTD
# 17 high as shown on the next chart is due to arrive September 2010.
U. S. DOLLAR INDEX CHART # 2
I have not often seen a setup as attractive as this one. All we need is the patience to wait for the bottom in September/October 2010. Of course we also need my projections to come about. I can not guarantee that they will develop as described, but if the amount and type of non-subscriber ridicule heaped on my head for even mentioning this is an indication of the probabilities for success, we have a winner.
U. S. DOLLAR INDEX MONTHLY CHART
THE FOLLOWING CHARTS REFLECT CLOSING PRICES FOR 10/16/200
Weekly volume has been declining ever since the high at $1033.90 in March 2008.
GOLD WEEKLY CHART
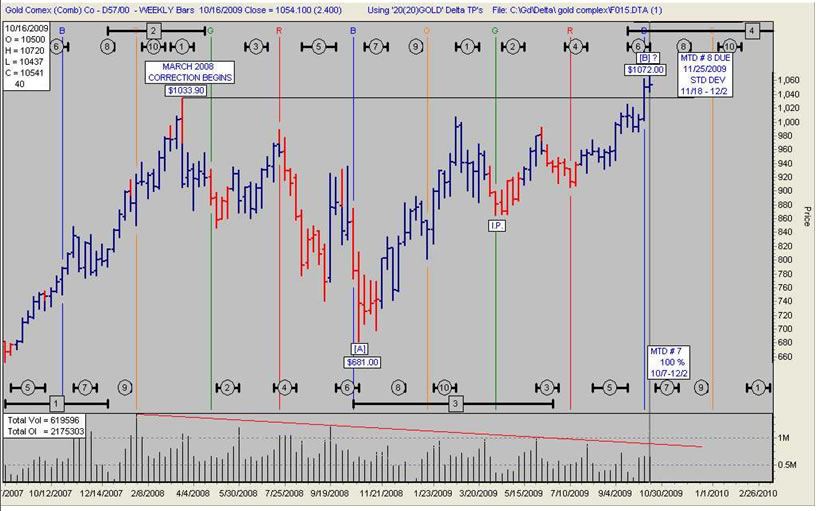
Volume has been declining during the entire [B] wave rally to new highs.
This is not bullish.
GOLD MONTHLY CHART
The momentum indicator beneath the chart is in the vicinity of previous peaks.
HUI MONTHLY
Subscriptions to the Rosen Market Timing Letter with the Delta Turning Points for gold, silver, stock indices, dollar index, crude oil and many other items are available at: www.wilder-concepts.com/rosenletter.aspx
By Ron Rosen
M I G H T Y I N S P I R I T


Ronald L. Rosen served in the U.S.Navy, with two combat tours Korean War. He later graduated from New York University and became a Registered Representative, stock and commodity broker with Carl M. Loeb, Rhodes & Co. and then Carter, Berlind and Weill. He retired to become private investor and is a director of the Delta Society International
Disclaimer: The contents of this letter represent the opinions of Ronald L. Rosen and Alistair Gilbert Nothing contained herein is intended as investment advice or recommendations for specific investment decisions, and you should not rely on it as such. Ronald L. Rosen and Alistair Gilbert are not registered investment advisors. Information and analysis above are derived from sources and using methods believed to be reliable, but Ronald L. Rosen and Alistair Gilbert cannot accept responsibility for any trading losses you may incur as a result of your reliance on this analysis and will not be held liable for the consequence of reliance upon any opinion or statement contained herein or any omission. Individuals should consult with their broker and personal financial advisors before engaging in any trading activities. Do your own due diligence regarding personal investment decisions.
Ronald Rosen Archive |
© 2005-2022 http://www.MarketOracle.co.uk - The Market Oracle is a FREE Daily Financial Markets Analysis & Forecasting online publication.