Best of the Week
Robert Prechter's - The DEFLATION Survival Guide - FREE 60 page Ebook
Most Popular of the Week
1.SELL Signal Alerts For Stocks, Bonds, Gold and Crude Oil- Anthony_Cherniawski
2.Stock Market Rally is Worth Shorting Here - Alistair_Gilbert
3.Deflationists Are WRONG, Prepare for the INFLATION Mega-Trend - Nadeem_Walayat
4.United States Economy At Zero Hour To Service Debt Mountain- John_Mauldin
5.Ukraine WHO and the Geopolitics of Swine Flu Panic- F_William_Engdahl
6.Stocks Bull Market Swing Juncture?- Nadeem_Walayat
7.Zinc Dimes, Counterfeit Tungsten Gold and Lost Interest- Jim_Willie_CB
8.If This is Economic Recovery, Where Are the Increased Tax Revenues?- John_Mauldin
Weeks Analysis
Gold Trend Channel Break OutOut What Does This Mean For You?- 20th Nov 09
A Wiser Use of Borrowed Money- 20th Nov 09
Gold GLD ETF Impact- 20th Nov 09
Gold Investing Expert: Bob Moriarty Goes on Record- 20th Nov 09
Gold Contrarians Will Get Killed- 20th Nov 09
How to Profit from the Falling U.S. Dollar With ETFs- 20th Nov 09
The Pro-Free-Market Program for Economic Recovery- 20th Nov 09
Gold’s Evolving Supply and Demand - 20th Nov 09
Good Inflation- 20th Nov 09
Is the U.S. Dollar Euro On the Turn?- 20th Nov 09
Obama in China Opening the Doors for Wall Street, Nothing More- 20th Nov 09
Keynes the Man as Rotten as His Economic Theory- 20th Nov 09
The U.S. Recession Jobless Interest Rate Conundrum- 20th Nov 09
U.S. Economy is a Geriatric on Viagra- 20th Nov 09
The Great U.S. China Romance- 20th Nov 09
Gold Steam Roller Running Towards $1300- 20th Nov 09
Betting on Beryllium for the New Nuclear Fuel Technology- 20th Nov 09
Dow and NASDAQ Stock Indices Ready for Major Reversal?- 20th Nov 09
Is the S&P Stock Market Index About to Plunge or Headed Higher? - 20th Nov 09
Central Bankers Blowing Bubbles in Global Stock Markets- 19th Nov 09
What If the Foreigners Stop Buying Our Debt?- 19th Nov 09
New Technology Turns Coal Into Clean, High-Powered Gas- 19th Nov 09
Cap-And-Trade "Three-Card Monte" Dead For 2009- 19th Nov 09
UK Budget Deficit Could Hit £200 Billion, 18% of GDP- 19th Nov 09
Energy and Precious Metals ETF Trading Report- 19th Nov 09
The New World Of Investing SPDR KBW Regional Banking KRE ETF- 19th Nov 09
U.S. Debt, Where’s the Money Going to Come From?- 19th Nov 09
Show Me the Money - 19th Nov 09
The Great Geopolitical Battle Over Energy Transit Routes- 19th Nov 09
Why Exaggerate Global Warming? Cop15 Failure And Peak Oil Success - 19th Nov 09
BubbleOmics: Dubai Property Market Down And Out…Or Bounce? - 19th Nov 09
What Has Government Done to the U.S. Dollar?- 18th Nov 09
Will Consumer Spending Really be Different This Time?- 18th Nov 09
More than 130 banks will have failed by the end of 2009. Is Your Bank Safe?- 18th Nov 09
Zinc Dimes, Counterfeit Tungsten Gold and Lost Interest- 18th Nov 09
Roubini Says Gold $2,000 is Utter Nonsense- 18th Nov 09
Central Banks Increasing Gold Reserves- 18th Nov 09
Fiat Money and Debt Monetization Pushing Gold Higher- 18th Nov 09
U.S. Real Estate Market Getting Worse- 18th Nov 09
Our Steroidally Challenged Economy- 18th Nov 09
Deflationists Are WRONG, Prepare for the INFLATION Mega-Trend - 18th Nov 09
U.S. Dollar on Death Row Means Boom Time for Gold Stocks- 17th Nov 09
USA Today, China Pushes Solar, Wind Development- 17th Nov 09
Revisiting Three Stages of Stocks Bear Market Rally, Right on Schedule- 17th Nov 09
Silver Cycles, Silver-to-Gold Ratio, and the USD Index Analysis- 17th Nov 09
Global Warfare, U.S. Military Operations in All Major Regions of the World- 17th Nov 09
What Strong U.S. Dollar Policy? - 17th Nov 09
Just Sell Something, Please!- 17th Nov 09
Gold Hard Money Wins Out!- 17th Nov 09
Gold On the Fast Track Toward $1,200?- 17th Nov 09
Gold $5000 By End 2010 on Monetary Debauchment - 17th Nov 09
U.S. Economy Will Dodge Double Dip Recession- 17th Nov 09
Beware of Credit and Debit Card Foreign Usage Charges this Winter- 17th Nov 09
Silver About to Explode Higher?- 17th Nov 09
Bernanke and Pinball Could Learn A Lot From Hong Kong’s Property Bubble - 17th Nov 09
U.S. Dollar Trend to Determine Next Trend for Gold, Stocks and Other Markets - 17th Nov 09
Goldman Sachs Betting on Derivatives Collapse Sparked Financial Crash?- 17th Nov 09
United States Economy At Zero Hour To Service Debt Mountain- 17th Nov 09
Extremely Low Global Food Storage Balances to Drive Agri-Food's Bull Market- 16th Nov 09
What Bernanke's Economic Recovery Means for U.S. Jobs- 16th Nov 09
GDP Forecasts Revised Higher and Gold Boosted by Negative Returns in All Currencies- 16th Nov 09
Second U.S. Economic Stimulus Package Headed Our Way?- 16th Nov 09
The Fed's Policy of Near Zero Interest Rates- 16th Nov 09
Market Trends for Gold, Crude Oil, and the U.S. Dollar- 16th Nov 09
Five Reasons China Is Not a Bubble- 16th Nov 09
Would the U.S. Start a War to Stimulate the Economy? - 16th Nov 09
Exciting Gold Stocks Performance Down Under in Australia- 16th Nov 09
U.S. Unemployment Projected Scenarios For the Next 10 Years- 16th Nov 09
Gold Is Busting Out All Over- 16th Nov 09
ETF Commodities Trading Analysis and Forecasts for GLD, SLV and UNG- 16th Nov 09
Deficit Doubles for Government's Pension Benefit Guaranty Corp- 15th Nov 09
Stock Market Failed Bearish Technical Setups May Be Bullish- 15th Nov 09
Gold Long Run on Route to $2,050 via $1,575- 15th Nov 09
Silvers Paradoxical Performance Relative to Gold, Strength With Weakness- 15th Nov 09
Barack Hoover Obama, The Audacity of Failure- 15th Nov 09
How the Financial Sector Servant Became a Predator - 15th Nov 09
Gold Short-term Overbought, Longterm Parabolic Bullish- 15th Nov 09
Stock Market Trend Too Uncertain to Call- 15th Nov 09
Stock Market Smart Money Turning Bearish- 15th Nov 09
What Is At Stake With Free Trade- 15th Nov 09
The New Command Economy Impact on Stocks and Crude Oil- 15th Nov 09
China Currency Manipulation About to Trigger Protectionism Crisis- 15th Nov 09
Stocks Bull Market Swing Juncture?- 15th Nov 09
China's Phony GDP Growth Data, Evidence Ordos the Empty City- 14th Nov 09
Financial System Designed Almost Exclusively to Benefit the Rich- 14th Nov 09
If This is Economic Recovery, Where Are the Increased Tax Revenues?- 14th Nov 09
Stock Market S&P500 Knocking at the 1100-1007 Door - 14th Nov 09
Stock Market Rally is Worth Shorting Here - 14th Nov 09
Manic-depressive Stock Market Inviting a Black Swan Event?- 14th Nov 09
Origins of the Federal Reserve Banking System- 14th Nov 09
Gold Momentum's Picking Up Dramatically- 13th Nov 09
Bankrupt States Seeking to Boost Their Revenues By Any Means- 13th Nov 09
Expansion of Global Fiat Currencies- 13th Nov 09
Financial Asset Bubble Spotting Isn’t Hard: But Whose Job Is It?- 13th Nov 09
Gold Price 2010 Forecast $1,500 and Seasonal Influences on Precious Metals- 13th Nov 09
Is the Gold and Silver Precious Metals Top Behind Us?- 13th Nov 09
Will the U.S. Lag on Alternative Energy Again?- 13th Nov 09
Protect and Profit Before the Coming Financial and Economic Storm- 13th Nov 09
Krugman's Magic Solution to Budgetary Woes- 13th Nov 09
SPX Stock Market Pullback to Drag Commodity Stocks Lower- 13th Nov 09
Has Gold Topped Out for the Year?- 13th Nov 09
Have the Dow and S&P500 Reached a Major Turning Point?- 13th Nov 09
Latest on U.S. Interest Rates, the Fed and Asset Price Inflation- 13th Nov 09
Is Mexico the “New” China?- 13th Nov 09
Ukraine WHO and the Geopolitics of Swine Flu Panic- 13th Nov 09
It's About Gold, Not Inflation or Deflation- 13th Nov 09
Winds of Economic and Geopolitical Change- 13th Nov 09
SELL Signal Alerts For Stocks, Bonds, Gold and Crude Oil- 13th Nov 09
Buying Government Bonds is a Mugs Game- 13th Nov 09
Best Cash ISA Tax Free Savings Account Update November 2009- 13th Nov 09

News Feeds
RSS Feeds

Free Instant Analysis

Free Instant Technical Analysis


Market Oracle FREE Newsletter

Most Popular 2009
1.UK Housing Market Crash and Depression Forecast 2007 to 2012 - Nadeem_Walayat (67,933)
2.Gold Price Forecast 2009 - Nadeem_Walayat (60,634)
3.Depression 2009 The Largest Train Wreck in Economic History - Darryl_R_Schoon (56,968)
4.Nouriel Roubini 2009 U.S. GDP Forecasting 40% Home Mortgage Failures? - Andrew_Butter (47,613)
5.Baby Boomers- Your Generation's Crisis Has Arrived - James Quinn (36.400)
6.The Financial War Against Iceland, Being Defeated by Debt is as Deadly as Outright Military Warfare - Prof Michael Hudson (35,542)
7.Ten Major Threats Facing the U.S. Dollar in 2009 - Eric_deCarbonnel (35,401)
8.Emerging Giants Russia, China, Brazil and India Looming Collapse 2009 - Martin Weiss (34,247)
9.Dow Jones Stock Market Forecast 2009 - Nadeem_Walayat (33678 )
10.Stealth Bull Market Follows Stocks Bear Market Bottom at Dow 6,470 - Nadeem_Walayat (33,082)
11. Economic & Financial Markets Forecast 2009: Collapsing Global Financial System Ponzi Scheme -Ty_Andros (32,413)
12.Hyperinflation Begining in China and Will Destroy the U.S. Dollar - Eric_deCarbonnel (31,215)
13. Stock Market Crash 2009: Fine Tuning DJIA Target To 5,800 - Eric_Chevrette (30,784)
14. .Stock Market to Fall AT LEAST Another 40%! - Martin Weiss (30,336)
15. Economic Forecast 2009: Deflation, Deleveraging, and Recession - John_Mauldin (28,922)
16.How Hedge Funds, Pyromaniacs and Gangsters Caused the Global Financial Crisis - Martin Hutchinson (28,636)
Most Popular 2008
1. The Great Depression 2008 - It can't happen to us....can it?”
2. The Battle for America Has Begun- Strategic Forecasts
3. UK House Prices Plunge Over the Cliff
4. US Banking System Teetering on the Brink of Collapse
5. US Economy Forecast 2008 - First Recession then Recovery
6. How Safe is My FDIC-Insured Bank Account?
7. Rising Risk of a Systemic Financial Meltdown:The 12 Steps to Financial Disaster By Nouriel Roubini
Most Popular 2007
1. US Housing Market Crash to result in the Second Great Depression
2. Operation FALCON - The USA is turning into a Police State
3. UK Housing Market Crash of 2007 - 2008 and Steps to Protect Your Wealth
4. US Housing Bubble Meltdown: "Is it too late to get out"?
5. Global Liquidity Crisis when the Credit Boom comes to an End
Most Popular 2006
1. Last Warning! Three-Pronged Collapse ... Stocks, Bonds and Real Estate
2. UK Interest Rate forecast for 2007 - Bank of England to do battle with inflation
3. UK Interest Rates Forecast to rise much higher due to rising Inflation and high Money Supply Growth
4. Emerging Markets outlook for 2007 - India, China, Russia, Eastern Europe and Brazil

Links

Money Forums
Certz
TradingTheCharts
Housing Market Forecasts
Local Issues


The Ultimate Analysis Handbook - FREE

Financial Markets Wedge Patterns Everywhere Means All Stocks May Sink

Stock-Markets / Financial Markets 2009 Oct 26, 2009 - 06:54 AM

By: Garry_Abeshouse

Stock-Markets

Diamond Rated - Best Financial Markets Analysis ArticleThis is a follow on to my October 13th 2009 posting , British Pound A Major Disaster Just Waiting to Happen? and my market update on October 19th, and deals with the markets as they stood as of last trade Friday October 23rd.

USD – Cl 75.47 - Price moves on Friday suggest that the next couple of weeks will be important not only for the USD but for all markets. If the large downward wedges in the USD charts are indeed what they appear to be then we should soon see a sharp confirming break upside to at least 77 - 79 for the first move. Contrary to this, a break below the 75 support to say below 74  could change the whole scenario.


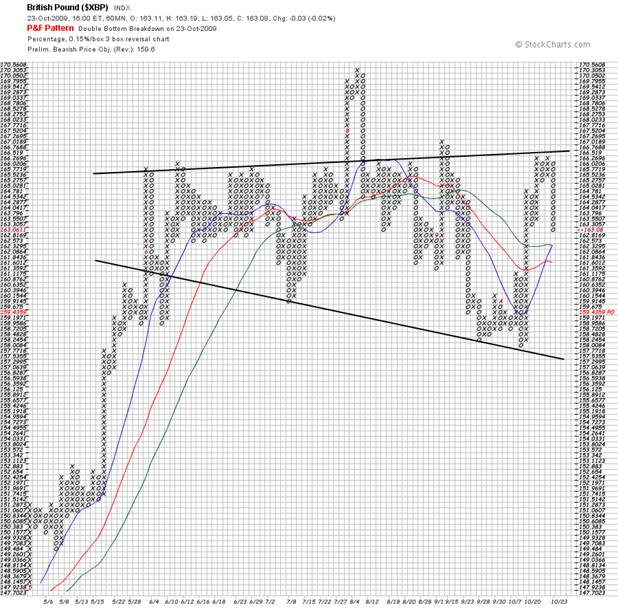
Watch the British Pound carefully, as I expect there will be a close inverse correlation between it and the USD, as discussed in my earlier posting. Below is an update of the USD daily chart shown against the Pound, the USD ETF as well as the P&F Chart on the Pound I posted earlier. Patterns on both charts suggests that if my suspicions are confirmed, the resultant moves in these markets will be sudden, swift and surprise many.

And as you can see from P&F chart on the Pound, resolution of its very well defined broadening pattern is likely to come fairly soon and be dramatic in its execution (the pun was intended). This pattern by the way is not so clear cut on other charts.


Gold – Cl 1055.20 – The continuous contract daily bar chart action on Friday (see chart below) does not look good for gold in the short term, suggesting that holding the 1050 support is now critical. A decent stab below this support would turn the small but critical consolidation area since October 6th into a distribution area making it much harder for gold to make its way into new highs in the short term. Should the conjunction of the three trend lines at Gold’s peak coincide with a fall in price, then this would further validate a longer term bearish view.

A fall below the pale blue support line below, drawn from the March 1033.90 high would also tend to validate a longer term bearish view.

 
Important support limits/lows below the 1050 are 986 and 906. I expect each break below these points to probably be accompanied by further falls in equities and the UK Pound, which would be associated with rises in the USD and US Treasury prices. Note that the 970/975 lows coincides with the support trend line from the February 2009 high at 1033.90. A break below this 18 month support for gold would signify longer term weakness and probably occur simultaneously with much stronger rally for the USD.

If and when gold really does want to head up into a new bull trend it will either show you its intent with dramatically increased volatility or just rocket off into the heavens overnight – either way you will know at that time that gold will be king again – but not before.

Yen/USD – Cl 1.0862 – The recent failure to penetrate the Dec/Feb highs below, significantly reduces the bullishness of the pair. As you can see the price is now testing the 50 day MA and would not have to fall much further to break the 200 day MA, which would also coincide with a break in the 14 month uptrend if I drew it in. As you can also see, the yen since April looks not dissimilar to the gold price and has, like the Euro, an inverse relationship now with the USD. These parameters are well defined and I expect will not take too long to be resolved, with the outlook looking more negative now than positive.

My longer term hand drawn charts will tolerate a move back to 1.04 to retain intact uptrends, which more or less coincides with a break in the 14 month trend on the daily chart.


It is easy to see the close inverse correlation since last March between the USD on one hand and the other currencies such as the Euro and the AUD, as well as silver, copper and equities on the other. The next few weeks should confirm whether these relationships will persevere into the future.


Equities - A brief word 

Nasdaq 100 – Cl 1753.63 - The high volatility and triple testing of the area just below 1780 on Comex at the top of the recent rise this month, suggests a high degree of confusion. This is more apparent on the more sensitive Comex chart than the daily chart below. I would expect from what I have read, that this confusion and low volume volatility we are seeing in the market generally has more to do with the poor timing of shorting decisions, rather than any strong feeling that the market will go much higher. And despite the recent price rises experienced by Microsoft and Amazon,  all long term resistance lines mentioned in my last posting on the main indexes remain intact, which leaves the market with little upward potential energy to force a way 2008 resistance areas.


S&P 500 – Cl 1079.60 - Comex charts suggest there could be some sort of attempt to rally on Monday, so this will be a good chance to see how much underlying strength the market really has - I suspect very little, even it if the market is somehow able to nudge into new highs. Ditto for the Dow. Should the market fall, there is little support between here and 1000/1020, the lower number being both an important uptrend and a testing of the early September lows (975 to 1000).


And as you can see below, the new equal weighted Dow Jones Global Dow Index of 180 of the worlds largest companies looks very similar to most of the other equity indexes. No further comment needed here.


Nasdaq Bank Index ($BANK) - Last 1649.67 – I consider the Nasdaq Bank Index a more conservative way of looking at the US Banks. And considering the way the major banks have rallied over the last seven and a half months, it’s quite surprising that this index has remained below the downtrend. This suggests that at this late stage in the bear market rally, the trend is most likely to stay intact, having reversed multiple times off it since early August 2009. It’s also surprising how little this index has risen since April compared to other sections of the market.

Any fall below 1600 would see a testing of the July 1500 lows, while a move below 1500 would probably confirm a major sell on the market. Not much leway here. A mere 150 points or just 9% between current prices and something I have no wish to contemplate. Watch this space.


The Philadelphia marine Shipping Index’s price action since March 2009 shares much in common in common with the Nasdaq Bank Index above.
Both underperformed during the rally and both peaked early during April/May, but the Shipping Index has a more pronounced upward wedge similar to other charts above. If this was truly the prelude to a new bull market you would expect the Shipping Index to be a leader rather than a lagger.

In September 2008, it was the sudden steep fall in the Dow Jones Corporate Bond Index that really confirmed that equity markets were in deep, very deep trouble. If or when a similar time comes again I expect the result to be the same. So watch this chart very carefully.


Australia

The three main Australian Indexes  I follow (ASX 200, ASX Financial ex Property Trusts, ASX Metals and Minerals) have formed well defined upward wedges since June/July 2009.

The ASX 200 and the Finance index are both edging through a series of fanned out uptrends on my intraday charts and are looking very vulnerable to falls, much like USA equities..

The Mining index has hit (for the fourth time) and is working below, a well defined resistance line going back to before June 2009. Any weakness in the copper price will have an adverse affect on this index forcing it below its four month uptrend.  

ASX - Woolworths (WOW) -  Last $29.31 - Woolworths is the largest and most profitable supermarket chain in Australia. After peaking at $35 AUD in December 2008 it fell to a low of $23. Since then it has been trading roughly in the range $23 to $30. On my hand drawn chart it has formed a well defined upward wedge formation since June 2009, not unlike many of the US stocks. Over the last week though, after peaking at about $30.50 last week it has fallen to $29.20 - decisively breaking through the uptrend. Short term would test support and the next uptrend at $27 in any market weakness.


Summary

At the moment I see an overextended bear market rally hanging with great fragility onto its highs. In the nearish future I expect a tipping point will push or shove equities over the edge. It is possible that initially anyway, weakness in the British pound may be THE tipping point factor that destabilises the world’s rather fragile recovery - unchanged high world debt levels and already faltering regional US banks not withstanding. I would like to remind the reader of lessons probably not learned from the late but not forgotten economist Hyman Minsky. He suggested that once markets entered what he called the Ponzi phase of the market cycle, where we see ourselves in at the moment, it would tend to be dominated by the extreme and unsettling behaviours of its strongest constituents – namely this time, the cowboy traders of the large banks and hedge funds, who with their highly leveraged $US592 trillion time bomb of derivatives, are holding us all to ransom.

There needs to be a lot of tooing and froing in the market place before it is decided to what extent the USD permabears and the gold permabulls will be winners or losers. This could take weeks or months, so timing is going to be a day to day affair, assessing the variables as all the dirt unfolds – and it will be dirty and messy with more losers than winners, that you can be sure.  

Till next time.

Garry Abeshouse
Technical Analyst.
Sydney
Australia

garrya@bigpond.net.au

I have been practicing Technical Analysis since 1969, learning the hard way during the Australian Mining Boom. I was Head Chartist with Bain & Co, (now Deutsch Bank)in the mid 1970's and am now working freelance. I am currently writing a series of articles for the international "Your Trading Edge" magazine entitled "Market Cycles and Technical Analysis".

I have always specialised in medium to long term market strategies and after discovering the excellent Point & Figure Charts from Stockcharts.com in mid 2008, have concentrated on this style of charting ever since.

© Copyright Garry Abeshouse 2009

Disclaimer: The above is a matter of opinion provided for general information purposes only and is not intended as investment advice. Information and analysis above are derived from sources and utilising methods believed to be reliable, but we cannot accept responsibility for any losses you may incur as a result of this analysis. Individuals should consult with their personal financial advisors.


Comments

gAnton
26 Oct 09, 21:19
US Government Stock Price Manipulation

During the Bush administration, I heard all the time about the "plunge team" which manipulated stock prices upward. I hear about gold market manipulation under Obnama, but nothing about the "plunge team". Are these guys still in business? Is there any way under the freedom of information act where the list of government ownership of stocks could be obtained?


Post Comment (Moderated)


(Note Commenting Issue: If after Submitting you are returned to the Main Index Page then due to site caching your comment has not been accepted. Solution - Click the Browser Back Button to the article page and Press PAGE REFRESH (you should see the message "You are not authorized to carry out this operation") Now re-enter your comment (ignoring the notice) - If all's well then you will remain on the article page after submitting, a moderator will check and authorise the comment. Alternatively EMAIL to comments @ marketoracle.co.uk , quoting the article number.

FREE Deflation Survival GuideFREE Updated 118 Page Independant Investor E-book